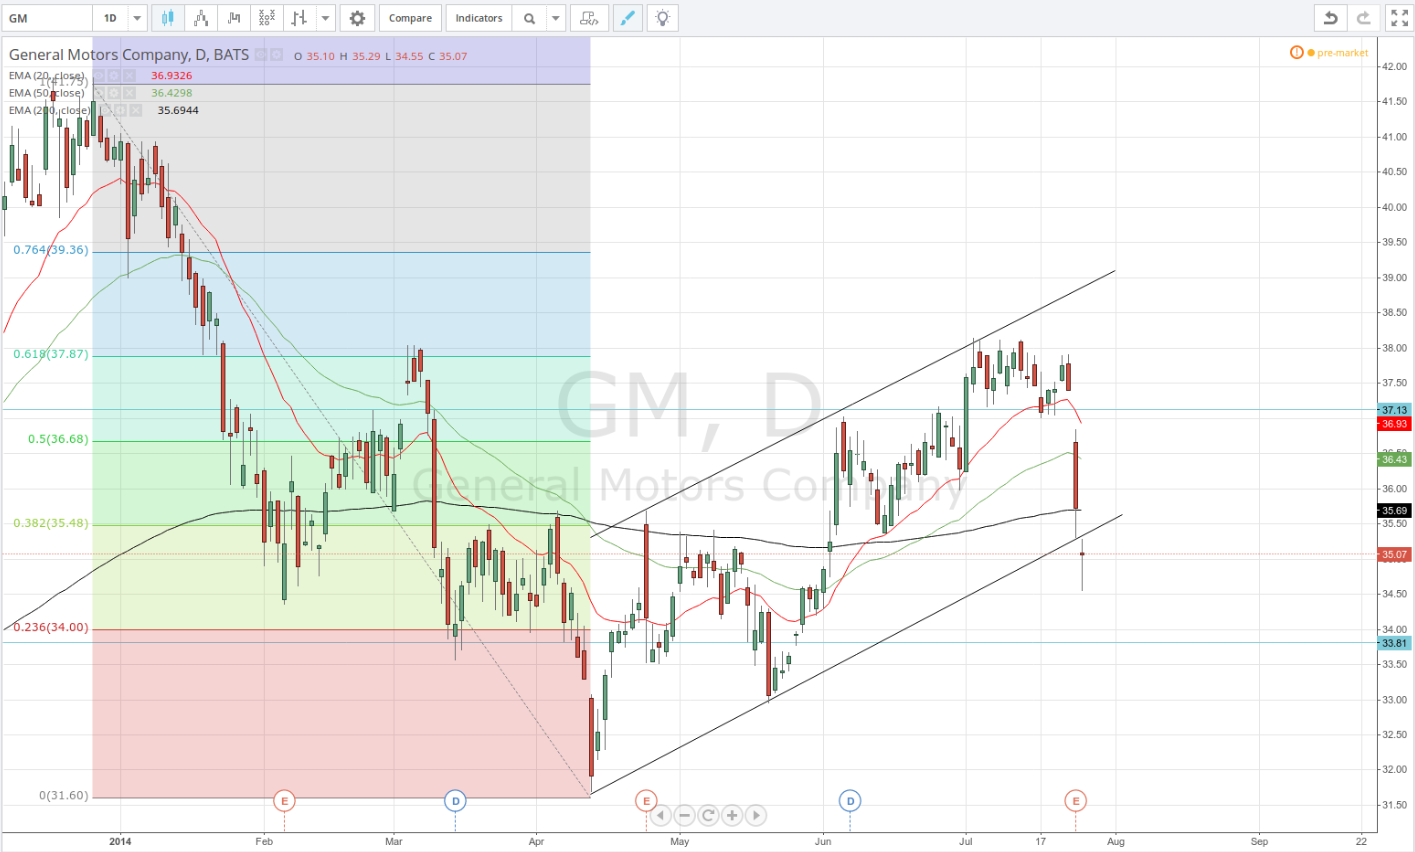
General Motors Company (GM) has demonstrated a plain bearish move since late December 2013, that lasted until April 11th. The 200-day Exponential Moving Average (the black line) has acted as a level of resistance on several occasions, but eventually the price broke above it, forming a bull channel.
After reaching the swing low on April 11th, GM bounced and tested the 38.2% Fibonacci retracement on April 24th. After May 20th we already had three swing points in order to construct a channel. On June 3rd the price breached the 200-day EMA, after which it tested the April 24th high and April 4th high (plain resistance levels) with the lows of June 4th, June 13th and July 24th candles. In the first two cases the 200-day EMA now acted as a support, while on July 24th the moving average was breached. This coincided with the Q2 earnings report, that fell short of market expectations.
The low of July 24th touched the lower boundary of the bull channel. At that point one might have expected a bounce to the upside, but however, it is quite common for any type of channel to attempt to reverse its direction, allowing the price to test even the beginning of the channel itself. On July 25th GM closed below the lower bound of the channel. In case the price shows a tendency to close conveniently below the lower boundary of the channel during the next several trading sessions, we have a reason to expect that a test of the beginning of the channel may indeed occur. An additional selling impulse may be the eventual crossing of the 20-day and the 50-day EMAs below the 200-day EMA.
In weekly terms, according to Binary Tribune’s analysis, the central pivot point for the stock stands at $35.85. In case an upside scenario unfolds, the three key resistance levels will be as follows: R1 – $37.13 (light blue line on the chart), R2 – $39.18, R3 – $40.46. In case a downside scenario unfolds, the three key support levels for the current week will be: S1 – $33.81 (light blue line on the chart), S2 – $32.52 and S3 – $30.47.