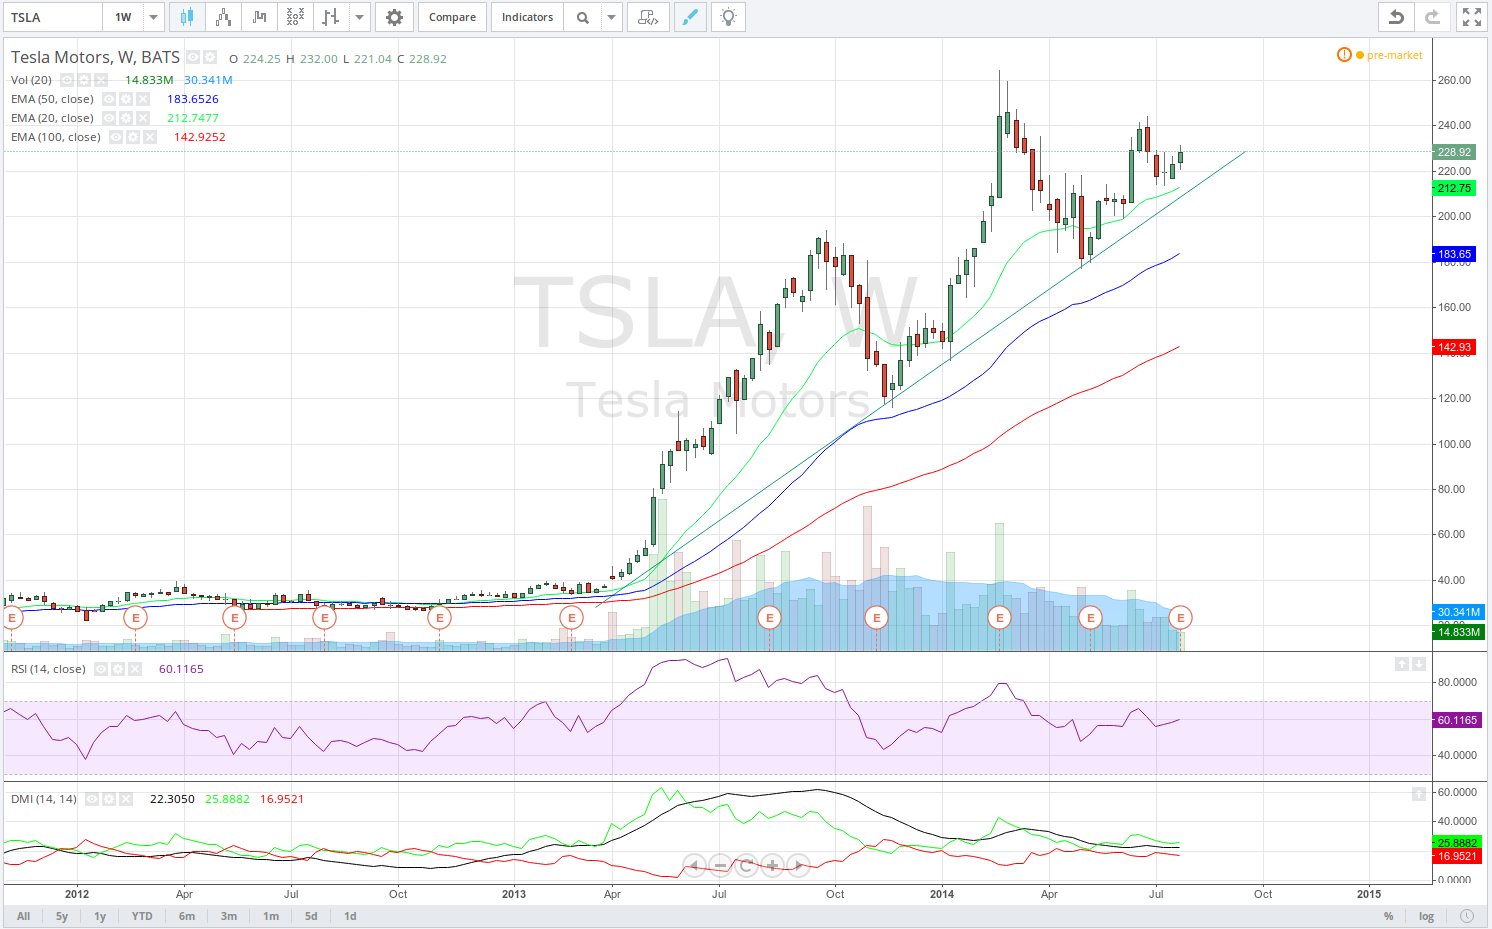
Tesla Motors has been in a resilient bull trend since March 2013, as the most prominent swing high was registered in February 2014 ($265.00). A pullback followed and was completed in May, after which the major trend resumed.
Confirmation was provided by the perfect order of the three Exponential Moving Averages (with their periods set to 20, 50 and 100 and the shortest one being on top) and by the Directional Movement Index (the black line on the chart), which climbed above its 20 level at the exact point, where the three EMAs crossed (the 20-day EMA crossed above the 50-day and the 100-day EMAs and the 50-day EMA also crossed above the 100-day EMA). In addition, the +DI (green line) has been above the -DI (red line) since late October 2013.
In June Tesla made the first attempt to test the swing high from February, but obviously failed to exceed it (a Lower High at $244.37).
As the significant bull trend line remains valid, the perfect order of the three EMAs is still in place, the +DI line is still above the -DI line and the DMI, having lost its prior momentum though, still remains above its 25 level (implying that bulls are still dominant), we have a reason to expect a trend continuation and a second test of the February high.
However, if the stock again fails to exceed that high, then it will probably move in the opposite direction, because, as is well known, in case the market attempts to do something twice and fails, it usually does the opposite. Bears may gain additional strength, in case the major trend line ends up breached during the move to the downside.
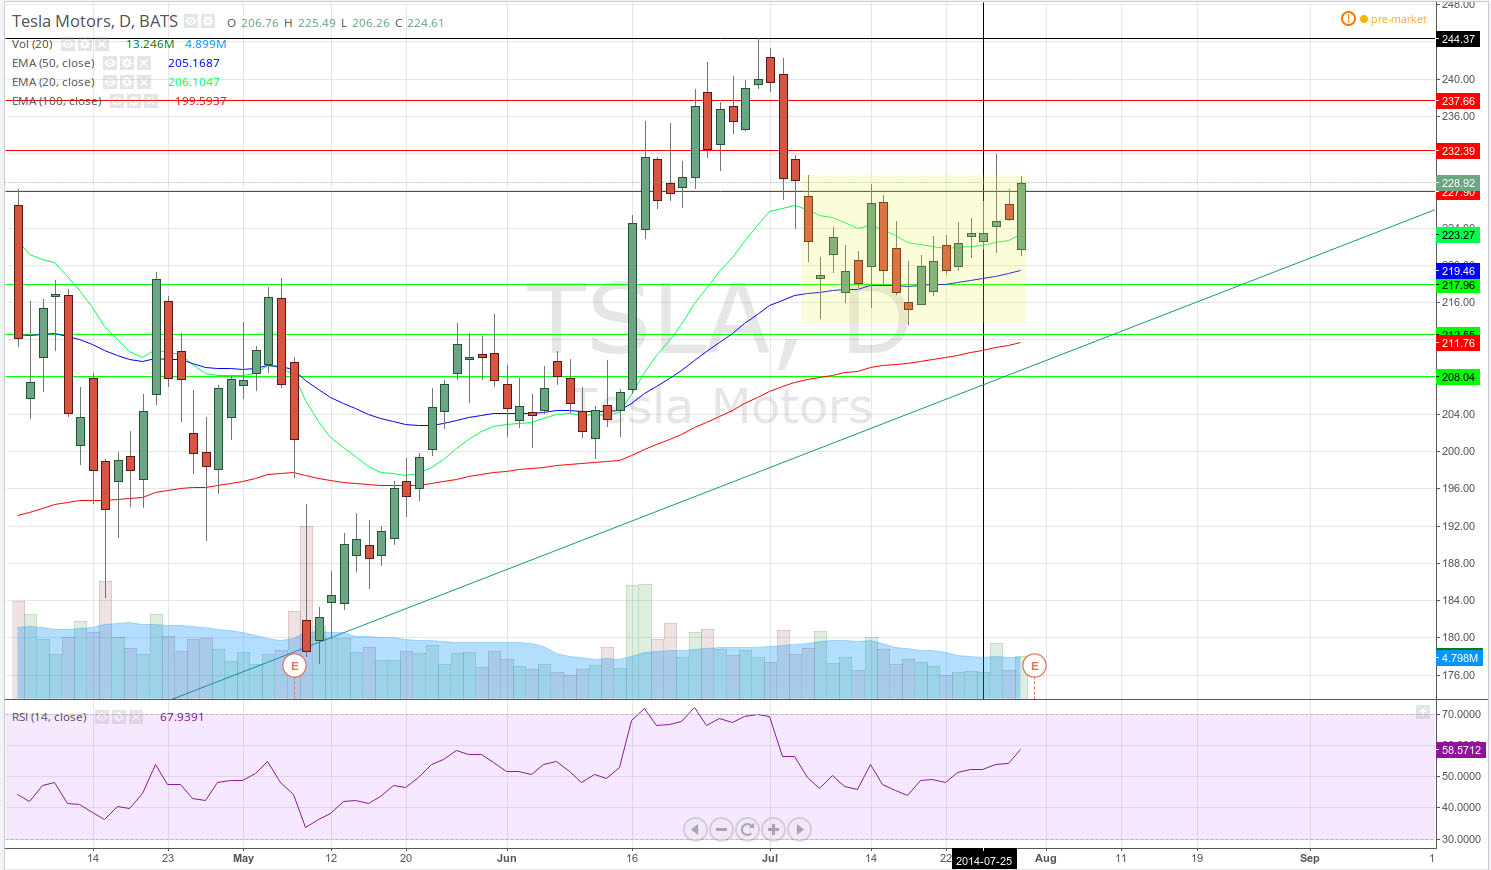
Dropping down to the daily time-frame, we see that the market has been in a so-called “barbed wire” trading range for more than three weeks (visualized by the yellow rectangle). The Barbed Wire formation is famous for its hard-to-predict breakouts, which is why traders are generally advised to abstain from trading the trading range before a confirmed breakout occurs. In our case, there are several factors which tip the scale in favor of an upward breakout.
First, we have the three EMAs arranged in the proper order to point a bullish trend – the EMA 100 is at the bottom, the EMA 50 is in the middle and the EMA with shortest trackback period is closest to the price. Additionally, all three are curved higher.
Second, RSI shows that a bullish trend is in motion, but there is enough place to move before hitting overbought at 70.
Third, the most recent bar closed at the high of the barbed wire range. It is very likely that after the recent failed attempt for a breakout, the market will perform a second one. Todays earnings report will be able to provide just enough volatility, given the results are satisfying enough.
Moreover, the market broke the first weekly pivot point resistance level (first red horizontal line) on Wednesday and closed above it, signifying bullish strength.
In case Tesla breaks out of the barbed wire to the upside, next resistance level will be encountered at R2 (around $232.39). If upside movement continues, it may extend to R3 at $237.66 and may even test the most recent swing high at $244.37.
Conversely, a downward breakout will see first support at the 50-day EMA, and then at S1 at around $217.96. If the down-move continues, the market will see support at S2 and S3 at around $212.55 and $208.04 respectively.