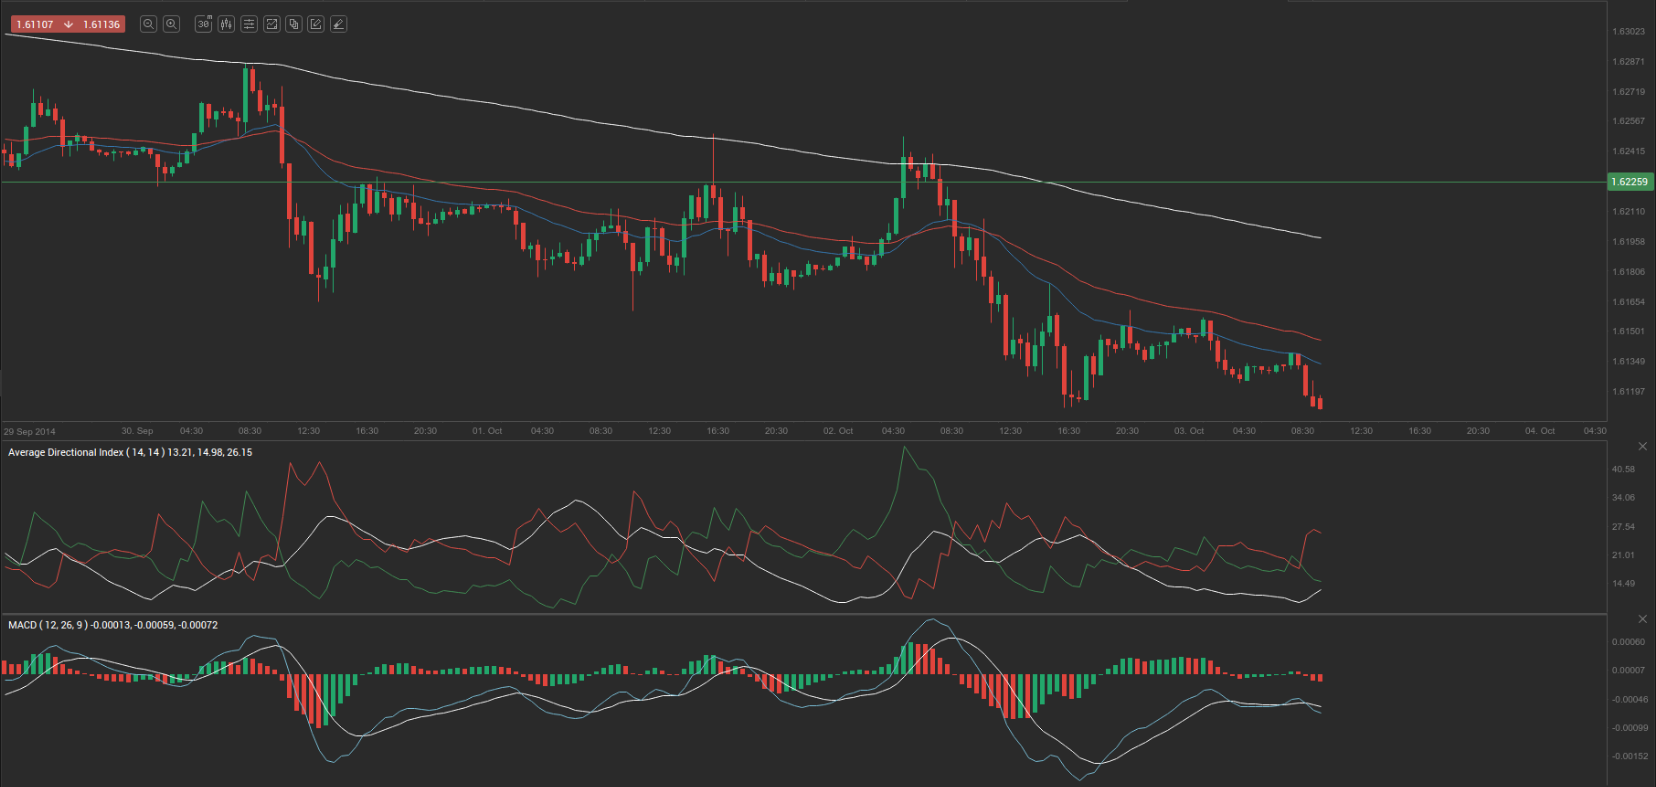
 Yesterday’s trade saw GBP/USD within the range of 1.6110-1.6251. The pair closed at 1.6143, losing 0.27% on a daily basis.
At 7:18 GMT today GBP/USD was down 0.14% for the day to trade at 1.6122. The pair broke the first and the second key weekly support levels and touched a daily low at 1.6114 at 7:25 GMT.
Fundamental view
United Kingdom
Activity in United Kingdom’s sector of services probably slowed down in September, with the corresponding PMI coming in at 59.1, down from 60.5 in the prior month. Augusts PMI reading has been the highest since October 2013. The index is based on a survey, encompassing managers of companies, that operate in sectors such as transportation, communications, IT, financial intermediation, tourism. They are asked about their estimate regarding current business conditions (new orders, output, employment, demand in the future). Values above the key level of 50.0 signify that activity in the sector has expanded. Larger than projected fall in the index value would certainly lower the appeal of the pound. The Chartered Institute of Purchasing and Supply (CIPS) is to announce the official reading at 8:30 GMT.
Yesterday UKs construction PMI was reported to have climbed to 64.2 in September, from 64.0 in August, reaching the highest reading in nine months. Analysts had expected a fall to 63.5.
United States
Change in Non-Farm Payrolls, Rate of Unemployment
Employers in all sectors of economy in the United States, excluding the farming industry, probably added 215 000 new jobs in September, according to the median forecast by experts, after a job gain of 142 000 in August, while the latter has been the least since December 2013. Professional and business services added 47 000 job positions in August and has added 639 000 during the past year. In August management of companies and enterprises gained 8 000 jobs. Employment continued to trend up over the month in administrative and support services (an increase by 23 000), architectural and engineering services (an increase by 3 000) and in management and technical consulting services (an increase by 3 000). Job growth in health care was 34 000 in August.
The non-farm payrolls report presents the total number of US employees in any business, excluding the following four groups: farm employees, general government employees, employees of non-profit organizations, private household employees. The reading, released most often, varies between + 10 000 and as much as + 250 000 at times when economy is performing well. Despite the volatility and the possibility of large revisions, the non-farm payrolls indicator presents the most timely and comprehensive reflection of the current economic state. Total non-farm payrolls account for 80% of the workers, who produce the entire Gross Domestic Product of the United States. In case of a larger-than-expected gain in jobs, the US dollar would receive a boost.
Average Hourly Earnings probably increased 0.2% in September compared to August, when earnings rose by another 0.2%.
The rate of unemployment in the country probably remained unchanged at 6.1% in September. It represents the percentage of the eligible work force that is unemployed, but is actively seeking employment. A person who is not classified as employed or unemployed is excluded from the statistics. One counts as unemployed, if he falls in all of the following categories: he/she was unemployed during the last week; he/she is able bodied; he/she has been seeking employment for a period of at least four weeks, which end during the week when the research is conducted. People, who have been laid off and are awaiting to be hired again, are also classified as unemployed. In case the unemployment rate met expectations or even fell further, this would cause a bullish impact on the greenback. The Bureau of Labor Statistics will release the official employment data at 12:30 GMT.
Balance of Trade
The deficit on US trade balance probably widened to 40.900 billion USD during August from a deficit of 40.546 billion USD, registered in July. If so, this would be the largest gap since May. The goods deficit dropped 0.2 billion USD to 60.2 billion USD in July compared to June, while the services surplus was virtually unchanged at 19.6 billion USD during the same period. Exports of goods rose 1.8 billion USD to 138.6 billion USD, while imports of goods surged 1.5 billion USD to reach 198.8 billion USD in July. Exports of services increased 0.1 billion USD in July from June, while imports of services were virtually unchanged, according to data by the US Bureau of Economic Analysis.
The trade balance, as an indicator, measures the difference in value between country’s exported and imported goods and services during the reported period. It reflects the net export of goods and services, or one of the components to form country’s Gross Domestic Product. Generally, exports reflect economic growth, while imports indicate domestic demand. In case the trade balance deficit widened more than anticipated, this would mount selling pressure on the US dollar. The Bureau of Economic Analysis will release the official trade data at 12:30 GMT.
ISM Non-Manufacturing data
Activity in United States’ sector of services probably slowed down in September, with the corresponding non-manufacturing PMI coming in at a reading of 58.5, according to expectations, from 59.6 in August. This is a compound index, based on the values of four equally-weighted components, that comprise it. These sub-indexes reflect seasonally adjusted new orders, seasonally adjusted employment, seasonally adjusted business activity and supplier deliveries.
The business report is based on data compiled from monthly replies to questions asked of over 370 purchasing and supply executives operating in over 62 different industries, which represent nine divisions from the Standard Industrial Classification (SIC) categories.
Participants can either respond with “better”, “same”, or “worse” to the questions about the industry, in which they operate. The resulting PMI value is measured from 0 to 100. If the index shows a value of 100.0, this means that 100% of the respondents reported an improvement in conditions. If the index shows a value of 0, this means that 100% or the respondents reported a deterioration in conditions. If 100% of the respondents saw no change in conditions, the index will show a reading of 50.0. Therefore, readings above the key level of 50.0 are indicative of expanding activity. In case activity slowed down more than anticipated, this would lead to a sell-off in the US dollar. The Institute for Supply Management (ISM) is to release the official PMI reading at 14:00 GMT.
Technical view
According to Binary Tribune’s daily analysis, the central pivot point for the pair is at 1.6168. In case GBP/USD manages to breach the first resistance level at 1.6226, it will probably continue up to test 1.6309. In case the second key resistance is broken, the pair will probably attempt to advance to 1.6367.
If GBP/USD manages to breach the first key support at 1.6085, it will probably continue to slide and test 1.6027. With this second key support broken, the movement to the downside will probably continue to 1.5944.
The mid-Pivot levels for today are as follows: M1 – 1.5986, M2 – 1.6056, M3 – 1.6127, M4 – 1.6197, M5 – 1.6268, M6 – 1.6338.
In weekly terms, the central pivot point is at 1.6300. The three key resistance levels are as follows: R1 – 1.6364, R2 – 1.6482, R3 – 1.6546. The three key support levels are: S1 – 1.6182, S2 – 1.6118, S3 – 1.6000.