 Yesterday’s trade saw EUR/CAD within the range of 1.4277-1.4481. The pair closed at 1.4447, gaining 1.04% on a daily basis.
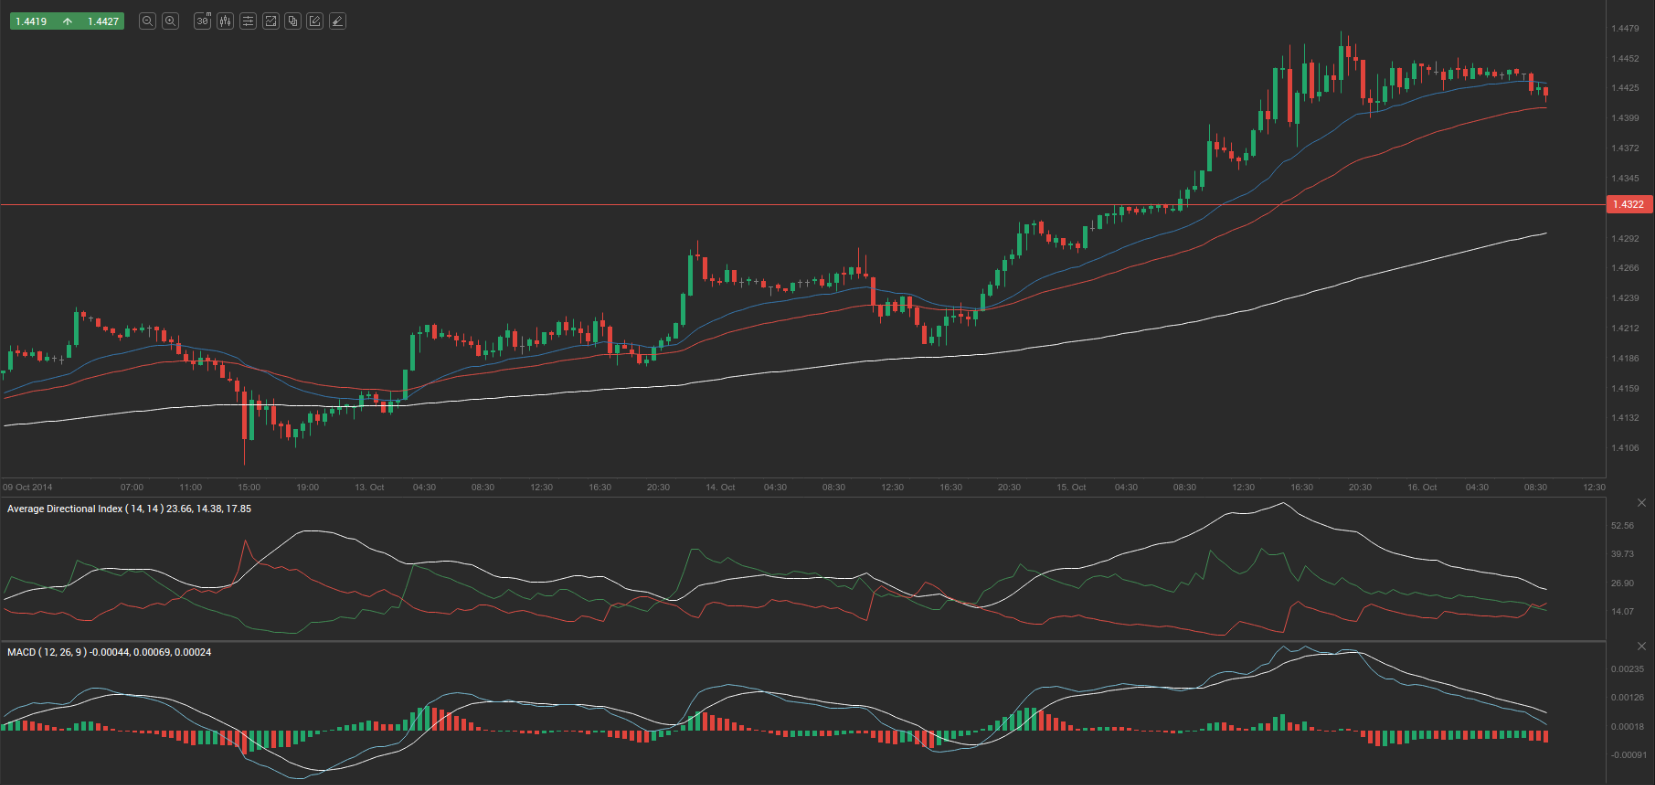
At 6:58 GMT today EUR/CAD was down 0.07% for the day to trade at 1.4430. The pair touched a daily low at 1.4424 at 6:51 GMT.
Fundamentals
Euro zone
Italian balance of trade
Italy probably had a surplus of 3.24 billion EUR on its trade balance in August, according to market expectations. Nations trade surplus expanded to 6.85 billion EUR in July this year, compared with a surplus figure of 5.98 billion EUR in July 2013, supported by shipments to the United States and the Euro region. Julys surplus figure is the largest on record. Total exports increased at an annualized rate of 1.1% to reach 38.55 billion EUR in July. Total imports dropped 1.4% to 31.69 billion EUR. The United States (18.4%), Czech Republic (16.4%) and Spain (10.8%) were the most dynamic markets for exports, according to data by Istat. At the same time, purchases from the OPEC countries (30.2%) and the Russian Federation (27.2%) dropped the most.
In case Italys trade surplus shrank more than expected, this might have a limited bearish effect on the single currency. The National Institute of Statistics (Istat) is to release the official trade data at 8:00 GMT.
Euro zone balance of trade
The surplus on Euro areas trade balance probably contracted to 9.0 billion EUR in August, according to the median forecast by experts, following a surplus figure of 21.2 billion EUR in July. In July 2013 the trade surplus was at the amount of 18.0 billion EUR. Total exports climbed at an annualized pace of 3% to 141.7 billion EUR in July, while imports rose 1% to reach 138.8 billion EUR.
The surplus on regions extra-EU28 trade balance amounted to 1.7 billion EUR in July this year compared to a surplus of 10.8 billion EUR in July 2013. The largest increases in EU28 exports were registered with China (a 10% gain during the period January-June 2014 compared to January-June 2013) and South Korea (an 8% gain). As for EU28 imports the highest increases were observed with South Korea (11%), Turkey (7%), China and Switzerland (both 5%).
Euro zones balance of trade produces regular surpluses mainly due to the high export of manufactured goods, such as machinery and vehicles. At the same time, the region is a net importer of energy and raw materials. Member states such as Germany, Italy, France and Netherlands play a key role in total trade.
The trade balance, as an indicator, measures the difference in value between region’s exported and imported goods and services during the reported period. It reflects the net export of goods and services, or one of the components to form the Gross Domestic Product. Generally, exports reflect economic growth, while imports indicate domestic demand. In case the trade balance surplus contracted more than anticipated in August, this would certainly have a bearish impact on the euro. Eurostat is to publish the official trade data at 9:00 GMT.
Euro zone harmonized CPI – final estimate
The annualized final consumer price index in the Euro zone, evaluated in accordance with Eurostat’s harmonized methodology, probably confirmed the preliminary estimate of 0.3% in September, according to the median forecast by experts. If confirmed, this would be the lowest level of the HICP since October 2009. In August the HICP has been revised up to 0.4%, up from a preliminary estimate of 0.3%. In September services is expected to have the highest annual rate among the components of the index (1.1%, compared to 1.3% in August), followed by food, alcohol and tobacco (0.2%, compared to -0.3% in August), non-energy industrial goods (0.1%, compared to 0.3% in the prior month) and energy (-2.4%, compared to -2.0% in August).
The index shows the change in price levels of a basket of goods and services from consumer’s perspective and also reflects purchasing trends. The main components of the HICP are food, alcohol and tobacco (accounting for 19% of the total weight), energy (11%), non-energy industrial goods (29%) and services (41%).
The HICP is used to evaluate and compare inflation rates between Member States, according to Art. 121 of the Amsterdam’s Agreement and directives by the European Central Bank (ECB), in order the latter to achieve price stability and the implementation of monetary policy. The HICP aggregates are calculated as a weighted average of each member state’s HICP components.
In case the HICP slowed down more than anticipated, thus, distancing from the 2% inflation objective set by the ECB, this would mount selling pressure on the euro, because of the greater possibility of introducing additional monetary policy measures in order to stimulate economic activity.
The annualized final Core HICP for September probably also matched the preliminary reading of 0.8%, reported on September 30th. In August the annualized core inflation was reported at 0.9%. This index excludes volatile categories such as food, energy, alcohol and tobacco. Eurostat is scheduled to release the official inflation data at 9:00 GMT.
Canada
Portfolio investment in Canadian securities
Foreign portfolio investment in Canadian securities probably shrank to 4.31 billion CAD in August, according to the median forecast by experts, from 5.30 billion CAD in July. This indicator reflects the flow of incoming investments in the local stock, bond and money markets. An increasing flow of foreign investments is usually related with a positive economic outlook for the country being invested in. This usually increases demand for its currency and vice versa. Therefore, in case portfolio investment in Canadian securities shrank more than anticipated, this would have a certain bearish effect on the loonie. The official data by Statistics Canada is due out at 12:30 GMT.
Manufacturing sales
Manufacturing sales in Canada probably dropped 1.6% in August compared to July, according to market expectations, following a 2.5% increase in July compared to June. If so, this would be the most significant monthly drop in shipments since April 2013. The Monthly Survey of Manufacturing features statistical data regarding sales of finished goods, inventories, unfilled orders and new orders in Canadian sector of manufacturing. About 10 500 items and 27 000 companies are encompassed.
Manufacturing sales are considered as an indicator of demand in the future. An increase in the number of goods and unsold inventories suggests, that demand is not sufficient and vice versa. On the other hand, an increase in sales (shipments) speaks of strong demand. Therefore, in case shipments decreased at a faster than projected pace, this might have a bearish impact on Canadas dollar. Statistics Canada will release the manufacturing data at 12:30 GMT.
Pivot Points
According to Binary Tribune’s daily analysis, the central pivot point for the pair is at 1.4402. In case EUR/CAD manages to breach the first resistance level at 1.4526, it will probably continue up to test 1.4606. In case the second key resistance is broken, the pair will probably attempt to advance to 1.4730.
If EUR/CAD manages to breach the first key support at 1.4322, it will probably continue to slide and test 1.4198. With this second key support broken, the movement to the downside will probably continue to 1.4118.
The mid-Pivot levels for today are as follows: M1 – 1.4158, M2 – 1.4260, M3 – 1.4362, M4 – 1.4464, M5 – 1.4566, M6 – 1.4668.
In weekly terms, the central pivot point is at 1.4138. The three key resistance levels are as follows: R1 – 1.4240, R2 – 1.4338, R3 – 1.4440. The three key support levels are: S1 – 1.4040, S2 – 1.3938, S3 – 1.3840.