 Yesterday’s trade saw GBP/USD within the range of 1.5588-1.5690. The pair closed at 1.5599, dipping 0.08% on a daily basis, or the first loss in the past three trading days. The daily high has been the highest level since July 1st, when the cross registered a high of 1.5737.
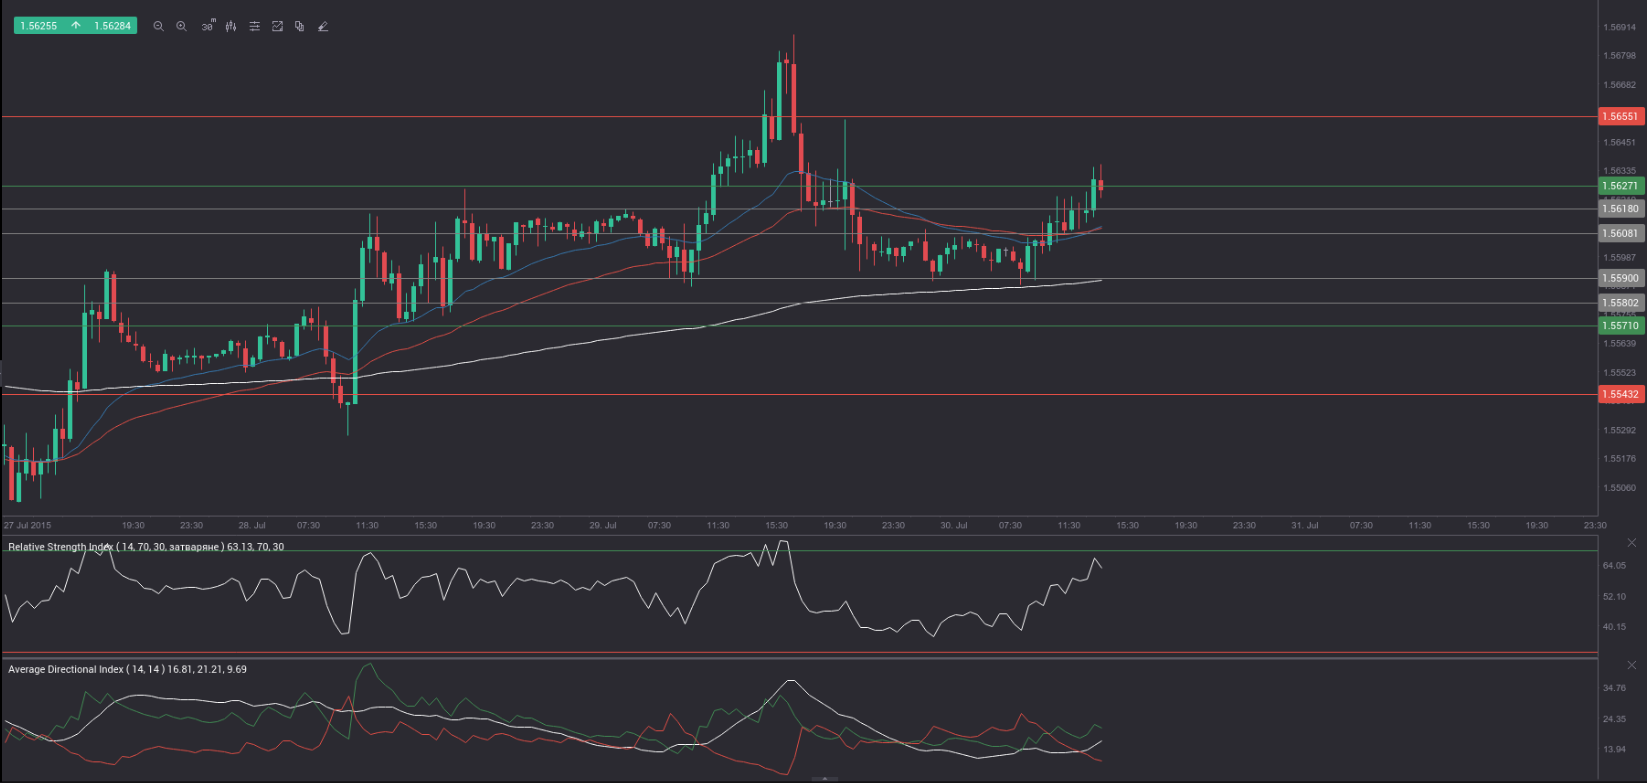
At 11:36 GMT today GBP/USD was up 0.21% for the day to trade at 1.5634. The pair overcame the range resistance level (R3) and touched a daily high at 1.5637 at 11:37 GMT. It is set to test the key range breakout level (R4) at 1.5655.
Today GBP/USD may be influenced by a number of macroeconomic reports as listed below.
Fundamentals
United States
Initial, Continuing Jobless Claims
The number of people in the United States, who filed for unemployment assistance for the first time during the week ended on July 24th, probably increased to 270 000, according to market expectations, from 255 000 in the prior week. The latter has been the lowest number of claims since November 1973 The 4-week moving average, an indicator lacking seasonal effects, was 278 500, marking a decrease of 4 000 compared to the preceding week’s unrevised average.
Jobless claims are usually more volatile during the summer period, as a number of plants close, mostly automakers, and also due to school vacations. Since the first week of March the number of claims has been below the 300 000 level, which suggests an improving labor market.
Initial jobless claims number is a short-term indicator, reflecting lay-offs in the country. In case the number of claims dropped more than projected, this would have a bullish effect on the US dollar.
The number of continuing jobless claims probably rose to the seasonally adjusted 2 211 000 during the week ended on July 17th from 2 207 000 in the prior week. The latter has been the lowest number of continuing jobless claims since the week ended on May 22nd, when 2 196 000 claims were reported. It also represented a decrease by 9 000 compared to the revised up number of claims, reported in the week ended on July 3rd. This indicator reflects the actual number of people unemployed and currently receiving unemployment benefits, who filed for unemployment assistance at least two weeks ago.
The Department of Labor is to release the weekly report at 12:30 GMT.
Gross Domestic Product – preliminary estimate
The preliminary estimate of the US Gross Domestic Product probably pointed to an annualized rate of growth of 2.6% in the second quarter of the year. The final GDP estimate for Q1, reported on June 26th, pointed to an annual growth of -0.2%. The latter missed the second GDP estimate, which pointed to a deeper contraction (-0.7%). It has also been the first GDP decline since Q1 2014, when economy shrank at an annualized pace of 2.1%. The decline in real GDP in Q1 primarily reflected negative contributions from exports, non-residential fixed investment, and state and local government spending. This negative influence was partly offset by positive contributions from Personal Consumption Expenditures, private inventory investment and residential fixed investment.
Real personal consumption expenditures rose 2.1% in the first quarter, compared with an increase of 4.4% in Q4 2014. Real non-residential fixed investment dropped 2.0% in the first quarter, compared to an increase of 4.7% during the fourth quarter of 2014. Real exports of goods and services went down 5.9% in the first quarter, following an increase of 4.5% in Q4 2014, while real imports of goods and services rose 7.1% in Q1, after another 10.4% surge in the preceding quarter. Real federal government consumption expenditures and gross investment remained unchanged in the first quarter, following a decrease of 7.3% in Q4 2014, according to the report by the Bureau of Economic Analysis.
In case the preliminary GDP estimate outpaced expectations, this would certainly heighten the appeal of the US dollar. The preliminary data is due out at 12:30 GMT.
Bond Yield Spread
The yield on UK 2-year government bonds went as high as 0.633% on July 29th, after which it slid to 0.612% at the close to gain 1 basis point (0.01 percentage point) on a daily basis, or the first gain in the past four trading days.
The yield on US 2-year government bonds climbed as high as 0.724% on July 29th, or the highest level since July 23rd (0.727%), after which it fell to 0.712% at the close to gain 4.2 basis points (0.042 percentage point) for the day, while marking a second daily increase in a row.
The spread between 2-year US and 2-year UK bond yields, which reflects the flow of funds in a short term, expanded to 0.100% on July 29th from 0.059% during the prior day. The July 29th yield spread has been the most notable one since July 7th, when the difference was 0.106%.
Meanwhile, the yield on UK 10-year government bonds soared as high as 1.985% on July 29th, after which it slid to 1.980% at the close to gain 3.7 basis points (0.037 percentage point) compared to July 28th, while marking a second straight day of gains.
The yield on US 10-year government bonds climbed as high as 2.297% on July 29th, or the highest level since July 23rd (2.343%), after which it closed at the same level to add 4.7 basis points (0.047 percentage point) on a daily basis, while marking a second consecutive day of gains.
The spread between 10-year US and 10-year UK bond yields widened to 0.317% on July 29th from 0.316% during the prior day. The July 29th yield difference has been the largest one since July 13th, when the spread was 0.345%.
Daily and Weekly Pivot Levels
By employing the Camarilla calculation method, the daily pivot levels for GBP/USD are presented as follows:
R1 – 1.5608
R2 – 1.5618
R3 (range resistance – green on the 30-minute chart) – 1.5627
R4 (range breakout – red on the 30-minute chart) – 1.5655
S1 – 1.5590
S2 – 1.5580
S3 (range support – green on the 30-minute chart) – 1.5571
S4 (range breakout – red on the 30-minute chart) – 1.5543
By using the traditional method of calculation, the weekly pivot levels for GBP/USD are presented as follows:
Central Pivot Point – 1.5550
R1 – 1.5636
R2 – 1.5757
R3 – 1.5843
S1 – 1.5429
S2 – 1.5343
S3 – 1.5222