 Yesterday’s trade saw EUR/USD within the range of 1.1086-1.1245. The pair closed at 1.1123, falling 0.92% on a daily basis and extending losses from Wednesday. The daily rate of decline has been the sharpest one since August 26th, when the cross depreciated 1.75%. The daily low has also been the lowest level since August 19th, when the cross registered a low of 1.1017.
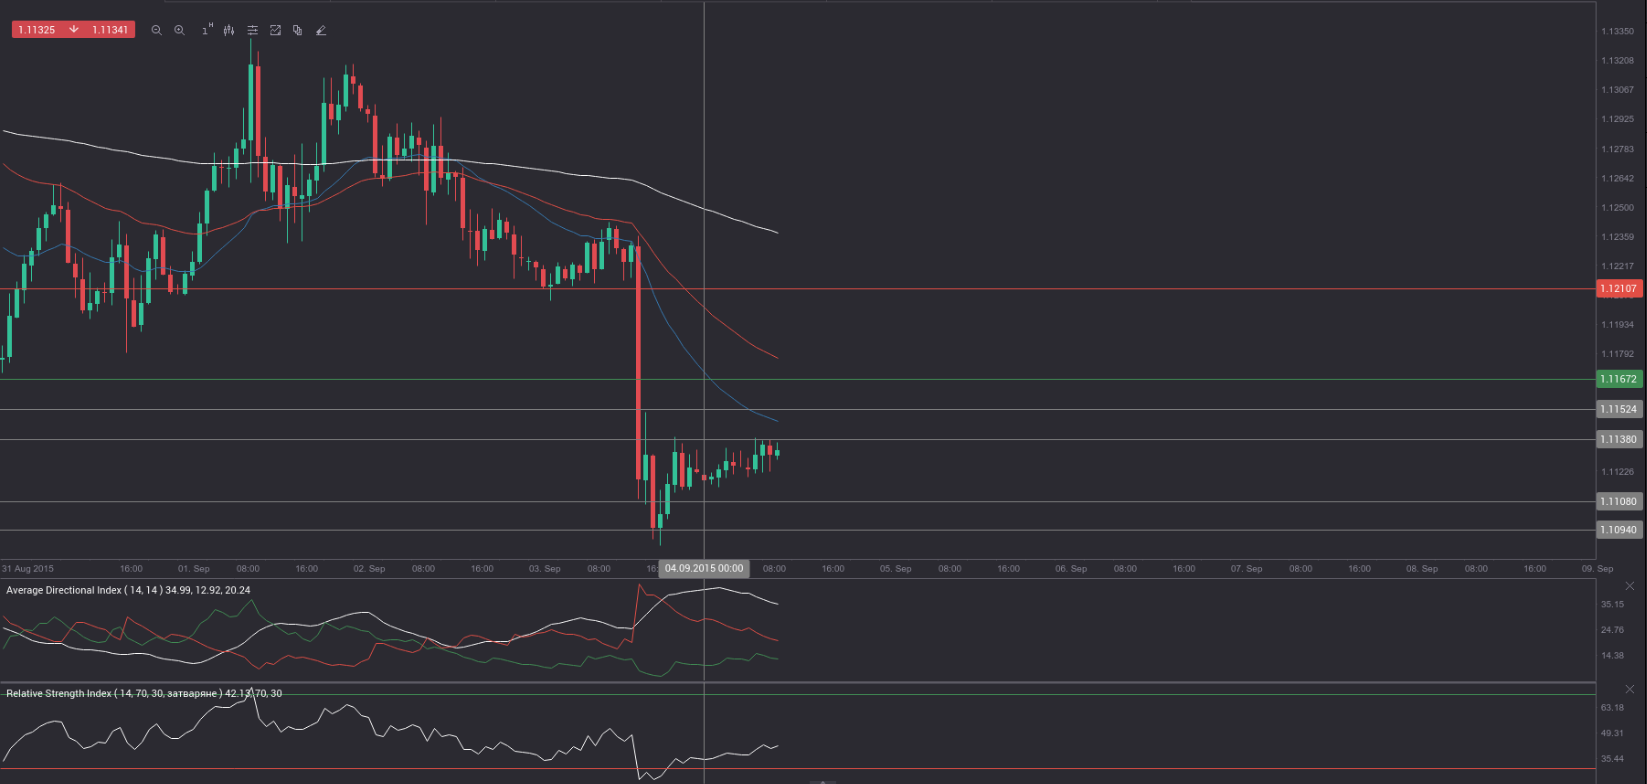
At 6:54 GMT today EUR/USD was up 0.05% for the day to trade at 1.1129. The pair tested the daily R1 level, as it touched a daily high at 1.1139 at 6:00 GMT.
Today the cross may be influenced by a number of macroeconomic reports as listed below.
Fundamentals
Euro area
Gross Domestic Product – final estimate
The seasonally adjusted final Gross Domestic Product in the Eurozone probably expanded at an annualized rate of 1.2% during the second quarter of 2015, according to market expectations. If so, it would match the preliminary estimate, reported on August 14th and would also be the fastest annual rate of growth since Q3 2011, when the regions GDP expanded 1.4%. In Q1 economy of the Euro area grew at a final 1.0%, which came in line with the preliminary estimate.
The final GDP during Q2 compared to the first quarter probably showed a 0.3% expansion, experts project. If so, it would match the preliminary estimate. In Q1 the regions economy expanded 0.4%.
The GDP growth for the areas leading economies fell short of expectations in Q2. The German economy expanded 0.4%, against expectations of 0.5% growth rate. Italy posted a 0.2% growth, below forecasts of 0.3%. The Dutch GDP rose 0.1%, again below the median estimate of 0.3%. French economy registered no growth, while expectations pointed to a 0.2% expansion. Spanish GDP, on the other hand, surged 1% in Q2, which has been the most significant quarterly rate in over eight years, according to the report by Eurostat.
In case economic growth in the single currency zone exceeded expectations, this would have a strong bullish effect on the euro. Eurostat is expected to release the final GDP report at 9:00 GMT.
United States
Non-farm Payrolls, Unemployment rate
Employers in all sectors of economy in the United States, excluding the farming industry, probably added 220 000 new jobs in August, according to the median forecast by experts, after a job gain of 215 000 in July. If so, this would be the fifth consecutive month, when employment gains exceeded 200 000.
Employment in retail trade rose by 36 000 in July. Health care employment increased by 28 000, while employment in financial services rose by 17 000. Manufacturing employment increased by 15 000, while the sector of transportation and warehousing added 14 000 jobs, according to the report by the Bureau of Labor Statistics (BLS).
The non-farm payrolls report presents the total number of US employees in any business, excluding the following four groups: farm employees, general government employees, employees of non-profit organizations, private household employees. The reading, released most often, varies between 10 000 and as much as 250 000 – 300 000 at times when economy is performing well. Despite the volatility and the possibility of large revisions, the non-farm payrolls indicator presents the most timely and comprehensive reflection of the current economic state. Total non-farm payrolls account for 80% of the workers, who produce the entire Gross Domestic Product of the United States. In case of a greater-than-expected gain in jobs, the US dollar would certainly see support.
Average Hourly Earnings probably increased a second month in a row in August, or 0.2%, according to the median forecast, following another 0.2% surge in July.
The rate of unemployment in the country probably dropped to 5.2% in August from 5.3% in July. If so, this would be the lowest rate since April 2008, when unemployment was registered at 5.0%.
In case the unemployment rate met expectations or even fell further, this would have a bullish effect on the greenback, because of the positive implications for consumer spending. The Bureau of Labor Statistics will release the official employment data at 12:30 GMT.
Bond Yield Spread
The yield on German 2-year government bonds went as high as -0.197% on September 3rd, after which it slid to -0.232% at the close to lose 3.1 basis points (0.031 percentage point) on a daily basis.
The yield on US 2-year government bonds climbed as high as 0.716% on September 3rd, after which it fell to 0.704% at the close to lose 0.008 percentage point for the day.
The spread between 2-year US and 2-year German bond yields, which reflects the flow of funds in a short term, widened to 0.936% on September 3rd from 0.913% during the prior day. The September 3rd yield spread has been the most notable one since August 18th, when the difference was 0.974%.
Meanwhile, the yield on German 10-year government bonds soared as high as 0.801% on September 3rd, after which it slid to 0.732% at the close to lose 6.3 basis points (0.063 percentage point) compared to September 2nd, while marking a second straight day of decline.
The yield on US 10-year government bonds climbed as high as 2.197% on September 3rd, after which it slipped to 2.167% at the close to lose 2.1 basis points (0.021 percentage point) on a daily basis.
The spread between 10-year US and 10-year German bond yields widened to 1.435% on September 3rd from 1.393% during the prior day. The September 3rd yield difference has been the largest one since August 28th, when the spread was 1.458%.
Daily and Weekly Pivot Levels
By employing the Camarilla calculation method, the daily pivot levels for EUR/USD are presented as follows:
R1 – 1.1138
R2 – 1.1152
R3 (range resistance – green on the 1-hour chart) – 1.1167
R4 (range breakout – red on the 1-hour chart) – 1.1210
S1 – 1.1108
S2 – 1.1094
S3 (range support – green on the 1-hour chart) – 1.1079
S4 (range breakout – red on the 1-hour chart) – 1.1036
By using the traditional method of calculation, the weekly pivot levels for EUR/USD are presented as follows:
Central Pivot Point – 1.1348
R1 – 1.1542
R2 – 1.1904
R3 – 1.2098
S1 – 1.0986
S2 – 1.0792
S3 – 1.0430