 On Tuesday gold for delivery in June traded within the range of $1,284.50-$1,301.50. Futures closed at $1,288.70, edging down 0.46% from Monday’s close. It has been the 30th drop in the past 64 trading days. The daily high has been a lower-high test of the high from May 2nd, while the latter is also a price level unseen since August 15th 2014. The precious metal has retreated 0.27% so far during the current month, following four consecutive months of advance. In April it added 4.46% to its value.
On the Comex division of the New York Mercantile Exchange, gold futures for delivery in June were gaining 0.89% on Tuesday to trade at $1,303.15 per troy ounce. The precious metal went up as high as $1,289.55 during the early phase of the Asian trading session, while the current daily low was at $1,280.50 per troy ounce, recorded during late Asian trade.
Today the precious metal may be influenced by the monthly report on US employment change by Automated Data Processing Inc. It may show that employers in the US non-farm private sector added 195 000 new jobs during April, according to market consensus, following 200 000 new positions added in March. In case new jobs growth outpaced expectations, this would have a moderate-to-strong bullish effect on the US dollar and a moderate-to-strong bearish effect on gold. The official figure is scheduled to be released at 12:15 GMT.
A separate report may show that the deficit on US balance of trade narrowed to USD 41.50 billion in March, according to market expectations, from a deficit figure of USD 47.06 billion in February. The latter has been the largest monthly trade deficit since August 2015, when a revised up gap of USD 48.00 billion was reported. In case the trade gap narrowed more than anticipated in March, this would strongly support demand for the US dollar and reduce demand for gold, because of the positive implications in regard to US growth. The Bureau of Economic Analysis will release the official trade data at 12:30 GMT.
Last but not least, the Institute for Supply Management (ISM) may report that activity in United States’ sector of services increased at a faster pace in April from a month ago, with the corresponding non-manufacturing PMI coming in at a reading of 54.9, according to the median forecast by experts, up from a level of 54.5 in March. If expectations were met, April would be the 76th consecutive month, when the gauge stood in the area above 50.0. It would also be the highest PMI reading this year. In case the Non-Manufacturing PMI accelerated at a sharper rate than anticipated, this would have a strong bullish effect on the US dollar and a strong bearish effect on gold. The ISM is to release the official PMI reading at 14:00 GMT.
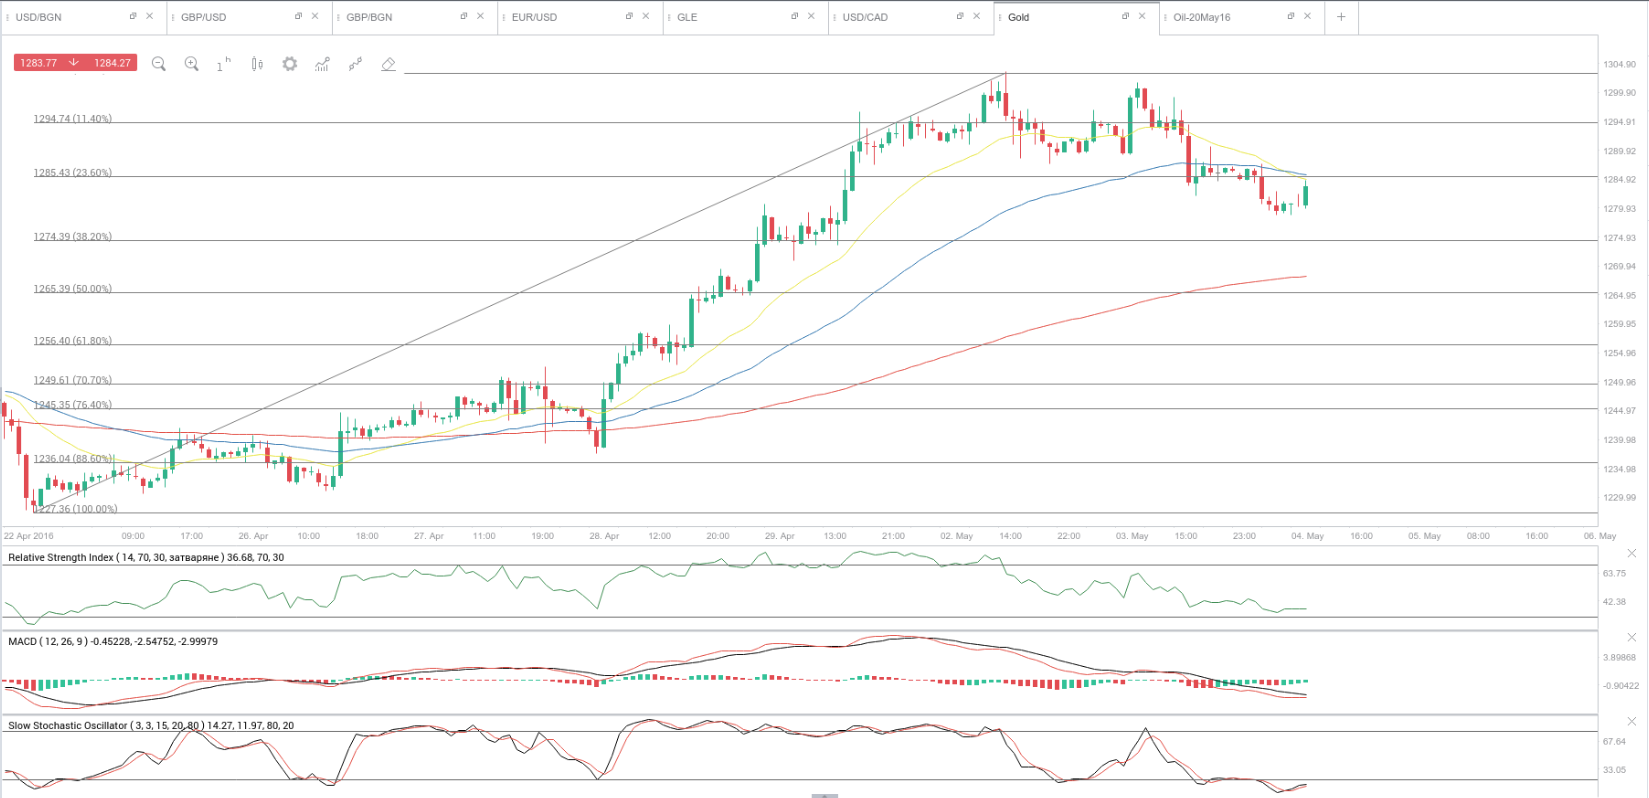
The commodity registered a failed attempt to break the high from May 2nd ($1,304.40) yesterday. As can be observed on the hourly time frame below, momentum remains bearish, the 14-period RSI inhabits the area below 50.00 and still has room before reaching its oversold level, while the 21-period EMA has crossed the 55-period EMA in a top-down manner, thus, the perfect order of the three EMAs no longer holds. If gold continues to retreat, a possible level of support would be the 38.2% Fibonacci ($1,274.39), which reflects the ascent from April 22nd low to May 2nd high and then – the hourly 200-period Exponential Moving Average ($1,268.25). Resistance, on the other hand, may be encountered at the hourly 55-period EMA (1,285.75) and then – at the current daily high of $1,289.55.
Meanwhile, silver futures for delivery in May were losing 0.74% on the day to trade at $17.340 per troy ounce, after going down as low as $17.250 a troy ounce during the early phase of the Asian trading session. It has been the lowest price level since April 28th, when a low of $17.140 a troy ounce was registered.
Daily and Weekly Pivot Levels
By employing the traditional calculation method, the daily pivot levels for gold are presented as follows:
Central Pivot Point – $1,291.57
R1 – $1,298.63
R2 – $1,308.57
R3 – $1,315.63
S1 – $1,281.63
S2 – $1,274.57
S3 – $1,264.63
By using the traditional method of calculation again, the weekly pivot levels for gold are presented as follows:
Central Pivot Point – $1,272.10
R1 – $1,312.60
R2 – $1,336.00
R3 – $1,376.50
S1 – $1,248.70
S2 – $1,208.20
S3 – $1,184.80