 On Wednesday (in GMT terms) gold for delivery in December traded within the range of $1,327.0-$1,344.1. Futures closed at $1,329.7, tumbling 1.22% compared to Tuesday’s close. It has been the 170th drop in the past 323 trading days and also the steepest one since August 5th. The daily low has been a level unseen since July 27th, when the commodity recorded a low of $1,323.0 a troy ounce. The precious metal has increased its slump to 2.05% so far in August, after surging 2.86% in July.
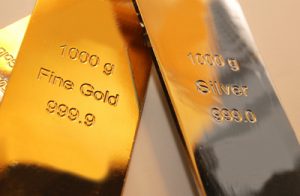
On the Comex division of the New York Mercantile Exchange, gold futures for delivery in December were edging down 0.10% on Thursday to trade at $1,328.4 per troy ounce. The precious metal went up as high as $1,330.2 during late Asian trade, while the current daily low was at $1,326.3 per troy ounce, recorded during the early phase of the Asian trading session.
The US Dollar Index, a gauge reflecting the relative strength of the greenback against a basket of 6 other major currencies, was edging down 0.16% on the day at a level of 94.58, after going down as low as 94.56 earlier. The gauge has increased its slump to 0.95% so far during the current month, following a 0.74% retreat in July.
Yesterday the precious metal lost ground sharply to levels unseen in a month on news that Glencore Plc is to sell a future output valued at AUD 880 million to the second largest producer in Australia, Evolution Mining Ltd. This way Evolution Minings overall output for the current fiscal year is expected to expand to 860 000 ounces.
Today gold trading may be strongly influenced by the monthly report on durable goods orders in the United States. The value of durable goods orders probably rebounded after two consecutive months of decline, going up 3.3% in July from a month ago, according to the median forecast by experts. In June orders fell at a revised down monthly rate of 3.9% (-4.0% previously). The value of durable goods orders, excluding transportation, probably rose 0.5% in July from a month ago, according to expectations, following a revised down 0.4% drop in June. If expectations were met, this would be the fastest monthly increase since April, when core orders went up at a revised up 0.5%. In case the general index went up at a faster-than-projected pace, this would have a strong bullish effect on the US dollar and a strong bearish effect on gold, due to positive implications in regard to the wider gauge of production, factory orders. The US Census Bureau is scheduled to release the official report at 12:30 GMT.
Gold has recently been pressured following a set of rather hawkish remarks by several Federal Reserve officials. Market participants await the public appearance of the Fed Chair, Janet Yellen, at the Jackson Hole symposium tomorrow, where she may deliver hints over the timing of the Banks next move on interest rates.
According to CME’s FedWatch Tool, as of August 24th, market players saw a 21.0% chance of a rate hike occurring at the Federal Reserve’s policy meeting in September, or unchanged compared to the prior business day, and a 25.9% chance of a hike in November, again unchanged from the preceding day. As far as the December meeting is concerned, the probability of such a move was seen at 50.6% on August 24th, or the same as expected in the preceding business day.
Meanwhile, silver futures for delivery in September were edging up 0.14% to trade at $18.582 per troy ounce, after going up as high as $18.620 a troy ounce during the late phase of the Asian trading session.
Daily, Weekly and Monthly Pivot Levels
By employing the Camarilla calculation method, the daily levels of importance for gold are presented as follows:
R1 – $1,331.3
R2 – $1,332.8
R3 (Range Resistance – Sell) – $1,334.4
R4 (Long Breakout) – $1,339.1
R5 (Breakout Target 1) – $1,344.6
R6 (Breakout Target 2) – $1,346.8
S1 – $1,328.1
S2 – $1,326.6
S3 (Range Support – Buy) – $1,325.0
S4 (Short Breakout) – $1,320.3
S5 (Breakout Target 1) – $1,314.8
S6 (Breakout Target 2) – $1,312.6
By using the traditional method of calculation, the weekly levels of importance for gold are presented as follows:
Central Pivot Point – $1,350.3
R1 – $1,360.2
R2 – $1,374.1
R3 – $1,384.0
R4 – $1,393.8
S1 – $1,336.4
S2 – $1,326.5
S3 – $1,312.6
S4 – $1,298.6
In monthly terms, for the yellow metal we have the following pivots:
Central Pivot Point – $1,348.5
R1 – $1,386.5
R2 – $1,415.4
R3 – $1,453.4
R4 – $1,491.4
S1 – $1,319.5
S2 – $1,281.5
S3 – $1,252.6
S4 – $1,223.6