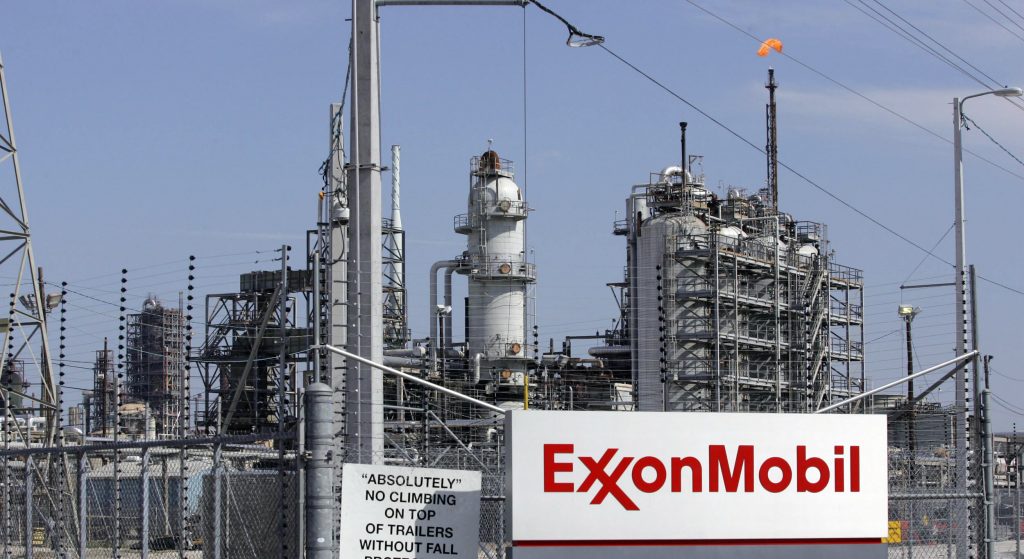
According to a statement by an executive from Exxon Mobil Corporation (XOM), the energy giant intends to market 1.3M metric tons of mid-term liquefied natural gas per year from its plant in Papua New Guinea, due to excess production and rising gas reserves. Having an original capacity of 6.9M tons per year, Exxon’s plant in the region had an output of 7.9M tons in 2016.
Exxon Mobil shares closed lower on Friday, while marking their second loss in the past ten trading sessions. The stock edged down 0.30% ($0.25) to $82.76, with the intraday high and the intraday low being at $83.36 and $82.68 respectively. In the week ended on April 9th the shares of the energy company added 0.91% to their market value compared to a week ago, which marked a second consecutive period of gains. However, the stock has pared its advance to 0.91% so far during the current month, following a 0.85% surge in March. For the entire past year, the shares of the NYSE-listed energy giant gained 15.79%.
Exxon has already said that the technically recoverable natural gas from all its fields in Papua New Guinea equals to 11.5T cf, according to Seeking Alpha. In comparison, a previous assessment pointed to 9.2T cf.
According to CNN Money, the 23 analysts, offering 12-month forecasts regarding Exxon Mobil’s stock price, have a median target of $87.00, with a high estimate of $105.00 and a low estimate of $72.00. The median estimate is a 5.12% surge compared to the closing price of $82.76 on April 7th.
The same media also reported that 16 out of 27 surveyed investment analysts had rated Exxon Mobil’s stock as “Hold”, while 5 – as “Buy”.
Daily and Weekly Pivot Levels
With the help of the Camarilla calculation method, today’s levels of importance for the Exxon Mobil stock are presented as follows:
R1 – $82.82
R2 – $82.88
R3 (Range Resistance – Sell) – $82.95
R4 (Long Breakout) – $83.13
R5 (Breakout Target 1) – $83.35
R6 (Breakout Target 2) – $83.44
S1 – $82.70
S2 – $82.64
S3 (Range Support – Buy) – $82.57
S4 (Short Breakout) – $82.39
S5 (Breakout Target 1) – $82.17
S6 (Breakout Target 2) – $82.08
By using the traditional method of calculation, the weekly levels of importance for Exxon Mobil Corporation (XOM) are presented as follows:
Central Pivot Point – $82.55
R1 – $83.76
R2 – $84.77
R3 – $85.98
R4 – $87.20
S1 – $81.54
S2 – $80.33
S3 – $79.32
S4 – $78.32