Boeing Companys (BA) second-quarter earnings and cash flow topped market expectations, supported by sizable cost reduction efforts. The plane maker also revised up its full-year core earnings forecast.
Boeing shares closed higher for a fourth consecutive trading session on Wednesday. It has also been the steepest daily surge in more than a year. The stock went up 9.88% ($20.99) to $233.45, after touching an intraday high at $233.86 and also a fresh all-time high. In the week ended on July 23rd the shares of the aircraft maker added 1.74% to their market value compared to a week ago, which marked a third consecutive period of gains. The stock has extended its advance to 18.05% so far during the current month, following a 5.39% surge in June. The latter has been a third consecutive monthly gain and also the sharpest one since February. For the entire past year, the shares of the NYSE-listed plane manufacturer gained 7.67%.
Boeing reported that cash from operations reached almost $5 billion during the second quarter. In comparison, the median analyst estimate had pointed to $2.5 billion in operating cash.
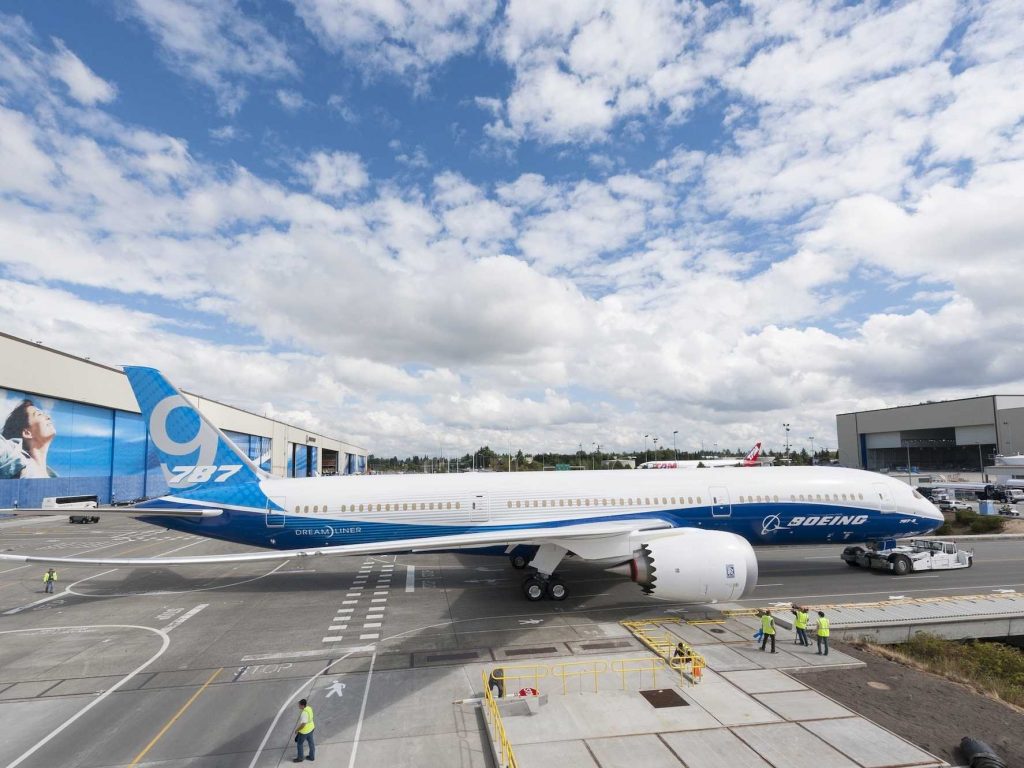
The 787 Dreamliner accounted for approximately $530 million in cash during the latest quarter, which, according to Reuters, has been the second-largest amount in the six years since the company initiated deliveries of the 787 jet.
As a result of the enormous extra cash, Boeing revised up its full-year 2017 operating cash flow forecast to $12.25 billion.
The company also said share buybacks would be increased by $3.5 billion in 2017 to approximately $10 billion.
Additionally, Boeings full-year capital expenditure is expected to be reduced by $300 million, as the plane manufacturer has already made the larger part of the planned investments in its 777X wing factory as well as in its 737 MAX and 787-10 programs.
Meanwhile, Boeings total revenue shrank 8.1% to $22.74 billion during the latest three-month period, or more than what market estimates had pointed ($23 billion).
The company reported a net income of $1.76 billion ($2.89 per share) during the second quarter, compared to a net loss of $234 million ($0.37 per share) during the same period of 2016. The latter came as a result of charges associated with Boeings 747, 787 and KC-46 tanker aircraft programs.
At the same time, core earnings, which exclude certain pension costs, were reported at $2.55 per share during the latest quarter. In comparison, analysts on average had anticipated core earnings of $2.30 per share.
The companys full-year 2017 core earnings forecast has been revised up by 60 cents to a range of $9.80-$10.00 per share.
According to CNN Money, the 20 analysts, offering 12-month forecasts regarding Boeing Company’s stock price, have a median target of $209.50, with a high estimate of $240.00 and a low estimate of $130.00. The median estimate is a 10.26% decrease compared to the closing price of $233.45 on July 26th.
The same media also reported that 9 out of 24 surveyed investment analysts had rated Boeing Company’s stock as “Hold”, while 8 – as “Buy”. On the other hand, 3 analysts had recommended selling the stock.
Daily and Weekly Pivot Levels
With the help of the Camarilla calculation method, todays levels of importance for the Boeing stock are presented as follows:
R1 – $234.44
R2 – $235.44
R3 (Range Resistance – Sell) – $236.43
R4 (Long Breakout) – $239.41
R5 (Breakout Target 1) – $242.89
R6 (Breakout Target 2) – $244.80
S1 – $232.46
S2 – $231.46
S3 (Range Support – Buy) – $230.47
S4 (Short Breakout) – $227.49
S5 (Breakout Target 1) – $224.01
S6 (Breakout Target 2) – $222.10
By using the traditional method of calculation, the weekly levels of importance for Boeing Company (BA) are presented as follows:
Central Pivot Point – $210.62
R1 – $213.72
R2 – $215.29
R3 – $218.39
R4 – $221.48
S1 – $209.05
S2 – $205.95
S3 – $204.38
S4 – $202.80