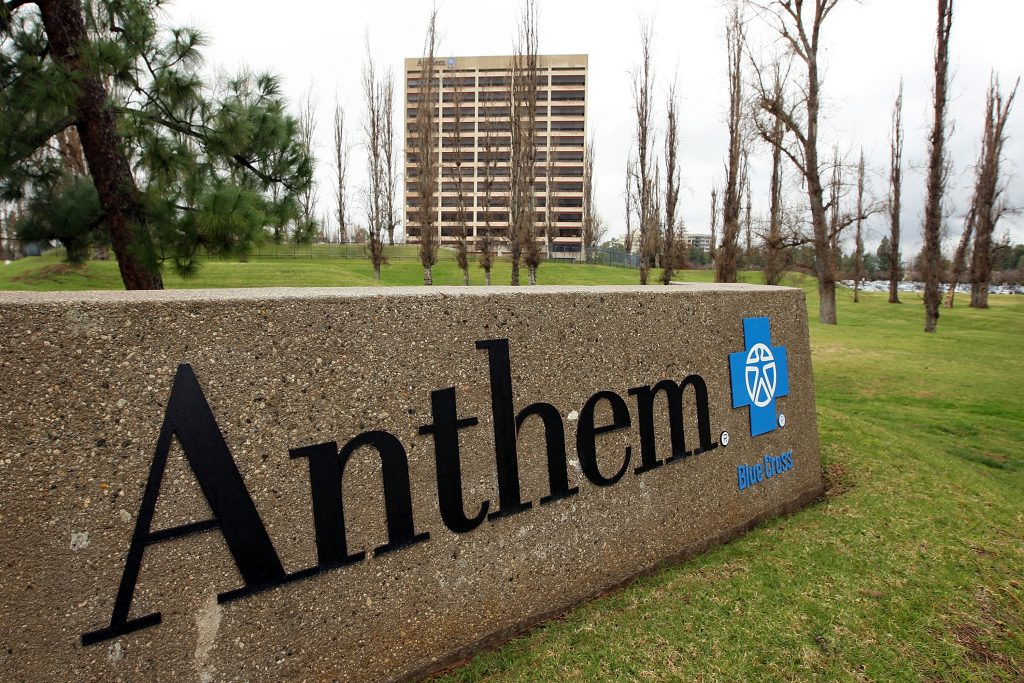
According to a statement by Joseph Swedish, Anthems Chief Executive Officer, on September 12th, the company is still considering its participation in some Obamacare markets in 2018.
Anthem shares closed lower for the fourth time in the past eight trading sessions on Tuesday. It has also been the steepest daily loss since November 1st 2016. The stock went down 3.42% ($6.71) to $189.24, after touching an intraday low at $188.00, or a price level not seen since August 2nd ($186.02). In the week ended on September 10th the shares of the health benefit company lost 1.81% of their market value compared to a week ago, which marked the first drop in the past four weeks and also the worst performance since the week ended on May 21st. The stock has extended its loss to 3.47% so far during the current month, following a 5.28% surge in August. The latter has been the ninth gain out of ten months and also the steepest one since April. For the entire past year, Anthem shares gained 3.11%. The stock has risen 31.63% so far in 2017.
Having reduced the number of states where it will offer individual Obamacare plans next year, Anthem, along with other insurance companies, were given a deadline until September 27th to finalize their role in the individual insurance program.
Speaking at an investor conference on Tuesday, CEO Joseph Swedish noted that Anthem had been relocating in some states and intended to re-enter the program at an appropriate moment, given the White House and Congress stabilize the individual markets.
According to CNN Money, the 17 analysts, offering 12-month forecasts regarding Anthem Inc’s stock price, have a median target of $206.00, with a high estimate of $243.00 and a low estimate of $160.00. The median estimate is an 8.86% surge compared to the closing price of $189.24 on September 12th.
The same media also reported that 9 out of 19 surveyed investment analysts had rated Anthem Inc’s stock as “Buy”, while 8 – as “Hold”.
Daily and Weekly Pivot Levels
With the help of the Camarilla calculation method, todays levels of importance for the Anthem stock are presented as follows:
R1 – $189.96
R2 – $190.68
R3 (Range Resistance – Sell) – $191.40
R4 (Long Breakout) – $193.56
R5 (Breakout Target 1) – $196.09
R6 (Breakout Target 2) – $197.15
S1 – $188.52
S2 – $187.80
S3 (Range Support – Buy) – $187.08
S4 (Short Breakout) – $184.92
S5 (Breakout Target 1) – $182.39
S6 (Breakout Target 2) – $181.33
By using the traditional method of calculation, the weekly levels of importance for Anthem Inc (ANTM) are presented as follows:
Central Pivot Point – $194.90
R1 – $197.93
R2 – $202.00
R3 – $205.03
R4 – $208.05
S1 – $190.83
S2 – $187.80
S3 – $183.73
S4 – $179.65


