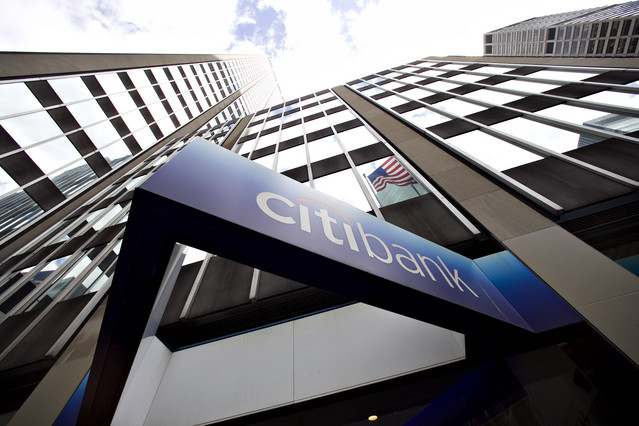
Citigroup Incs (C) second-quarter earnings outstripped market expectations, supported by a stronger performance in consumer banking in Mexico, North America and Asia. Results were also influenced by the lower income tax rate and higher demand for loans amid growing US economy.
Citigroup shares closed lower for the third time in the past seven trading sessions in New York on Friday. It has also been the steepest daily loss since May 29th. The stock went down 2.20% ($1.51) to $67.00, after touching an intraday low at $66.22, or a price level not seen since July 6th ($65.90).
Shares of Citigroup Inc have retreated 9.96% so far in 2018 compared with a 4.78% gain for the underlying index, S&P 500 (SPX).
In 2017, Citigroup’s stock surged 25.21%, thus, it outperformed the S&P 500, which registered a 19.42% return.
Citigroups total revenue went up 2% to $18.47 billion during the second quarter ended on June 30th, falling short of the median analyst estimate of $18.51 billion.
Revenue from fixed income trading dropped 6% year-on-year during the quarter, while revenue from equity trading surged 19%.
The banks net income was reported to have risen to $4.49 billion during the quarter ended on June 30th, from $3.87 billion during the same period a year ago, as net income from its global consumer banking operations surged 14%.
On the other hand, revenue from the groups investment banking business shrank 7% during the quarter.
The Wall Street bank earned $1.63 per share during the second quarter compared with earnings of $1.28 per share during the same period a year earlier. Analysts on average had expected earnings of $1.56 per share.
Citigroup’s provision for income tax reportedly shrank by $351 million, after the Trump administration slashed the corporate tax rate.
According to CNN Money, the 27 analysts, offering 12-month forecasts regarding Citigroup Inc’s stock price, have a median target of $83.00, with a high estimate of $101.00 and a low estimate of $62.00. The median estimate represents a 23.88% upside compared to the closing price of $67.00 on July 13th.
The same media also reported that 14 out of 28 surveyed investment analysts had rated Citigroup Inc’s stock as “Buy”, while 9 – as “Hold”. On the other hand, 1 analyst had recommended selling the stock.
Daily and Weekly Pivot Levels
With the help of the Camarilla calculation method, Monday’s levels of importance for the Citigroup stock are presented as follows:
R1 – $67.19
R2 – $67.38
R3 (Range Resistance – Sell) – $67.57
R4 (Long Breakout) – $68.14
R5 (Breakout Target 1) – $68.80
R6 (Breakout Target 2) – $69.09
S1 – $66.81
S2 – $66.62
S3 (Range Support – Buy) – $66.43
S4 (Short Breakout) – $65.86
S5 (Breakout Target 1) – $65.20
S6 (Breakout Target 2) – $64.91
By using the traditional method of calculation, the weekly levels of importance for Citigroup Inc (C) are presented as follows:
Central Pivot Point – $67.52
R1 – $68.83
R2 – $70.65
R3 – $71.96
R4 – $73.26
S1 – $65.70
S2 – $64.39
S3 – $62.57
S4 – $60.74


