Strategy #1. Combining Moving Averages and the Relative Strength Index
 By combining several technical tools and indicators, a trader could end up with a multitude of technical analysis-based strategies for any trading instrument. It all depends on how well he/she reads the data on a price chart or how well he/she understands the “reading” of a particular indicator. For a detailed look into technical analysis and all its aspects, you can check our Forex Academy as well as our guides related to Price Action Trading, Forex Trading Strategies and Technical Forex Trading Indicators.
It is well known that a relatively simple and tested trading approach could yield better results compared to a sophisticated and little tested strategy. Here we provide a simple to understand technical method, which could be implemented successfully not only in Forex, but also in Bitcoin trading.
For the purpose of the current strategy we will be using the daily timeframe along with the following technical indicators – a 5-day Exponential Moving Average (EMA), a 12-day EMA and the Relative Strength Index (RSI) with its period set to 21.
As a Bitcoin trader, you will usually look to go long, when the 5-day EMA (yellow on the chart below) crosses the 12-day EMA (green on the chart below) from below to the upside, while the Relative Strength Index (RSI) has already crossed above its 50.00 level. The long position should be closed, when the 5-day EMA crosses the 12-day EMA from above to the downside or the RSI falls below its 50.00 level. Let us visualize that.
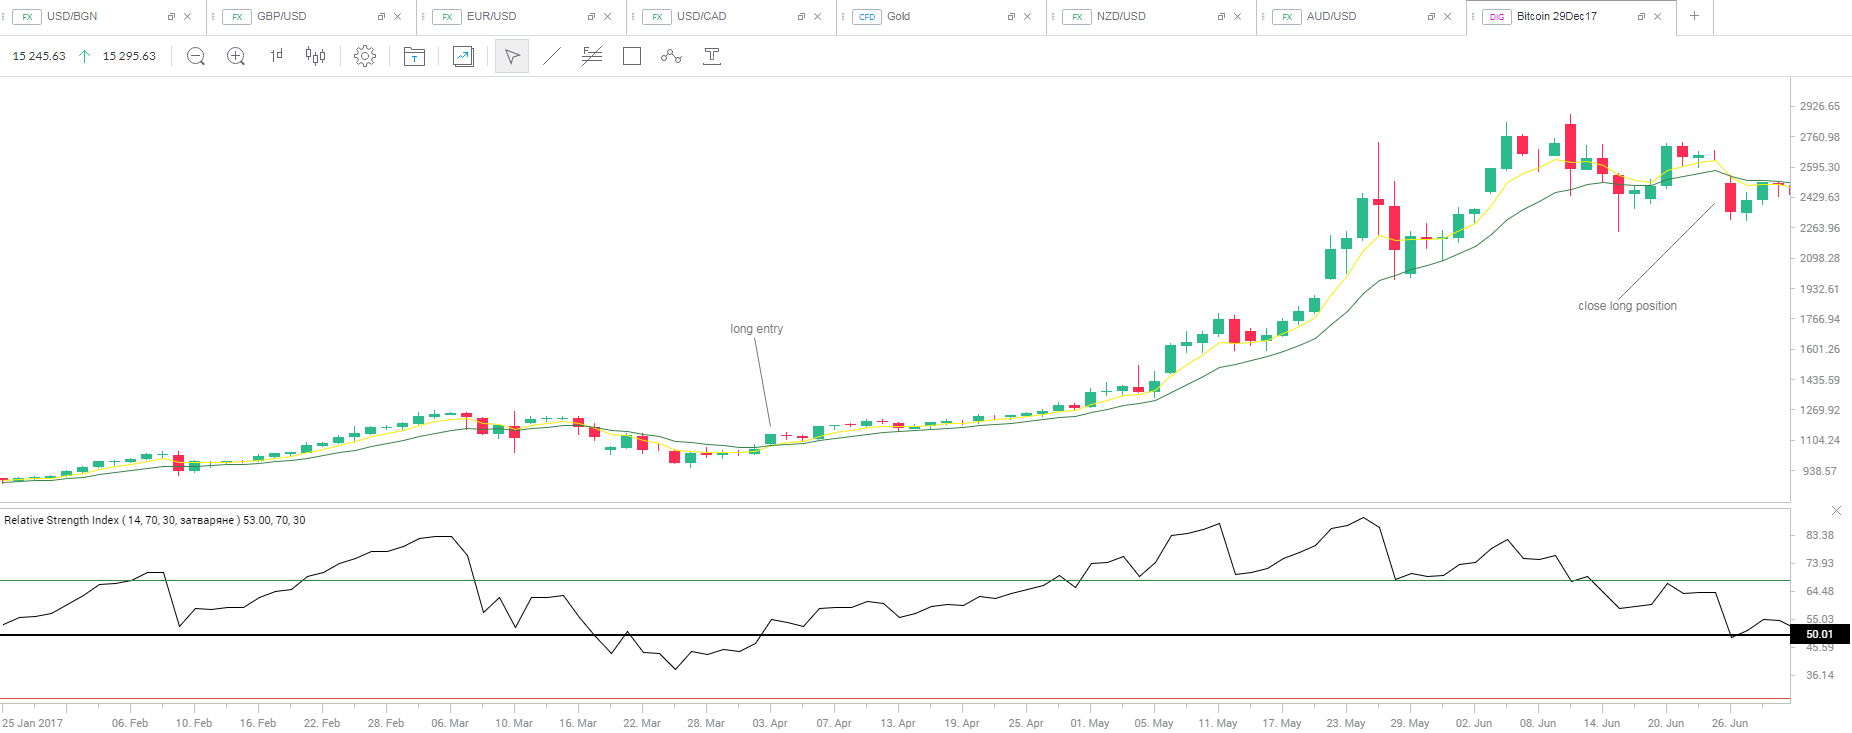
On the daily price chart of Bitcoin, the 5-day EMA crossed the 12-day EMA in a bottom-up manner on April 2nd, which coincided with a move of the RSI above its 50.00 level. We opened a long position on April 3rd and rode the upside move until June 26th, when the 5-day EMA crossed the 12-day EMA in a top-down manner.
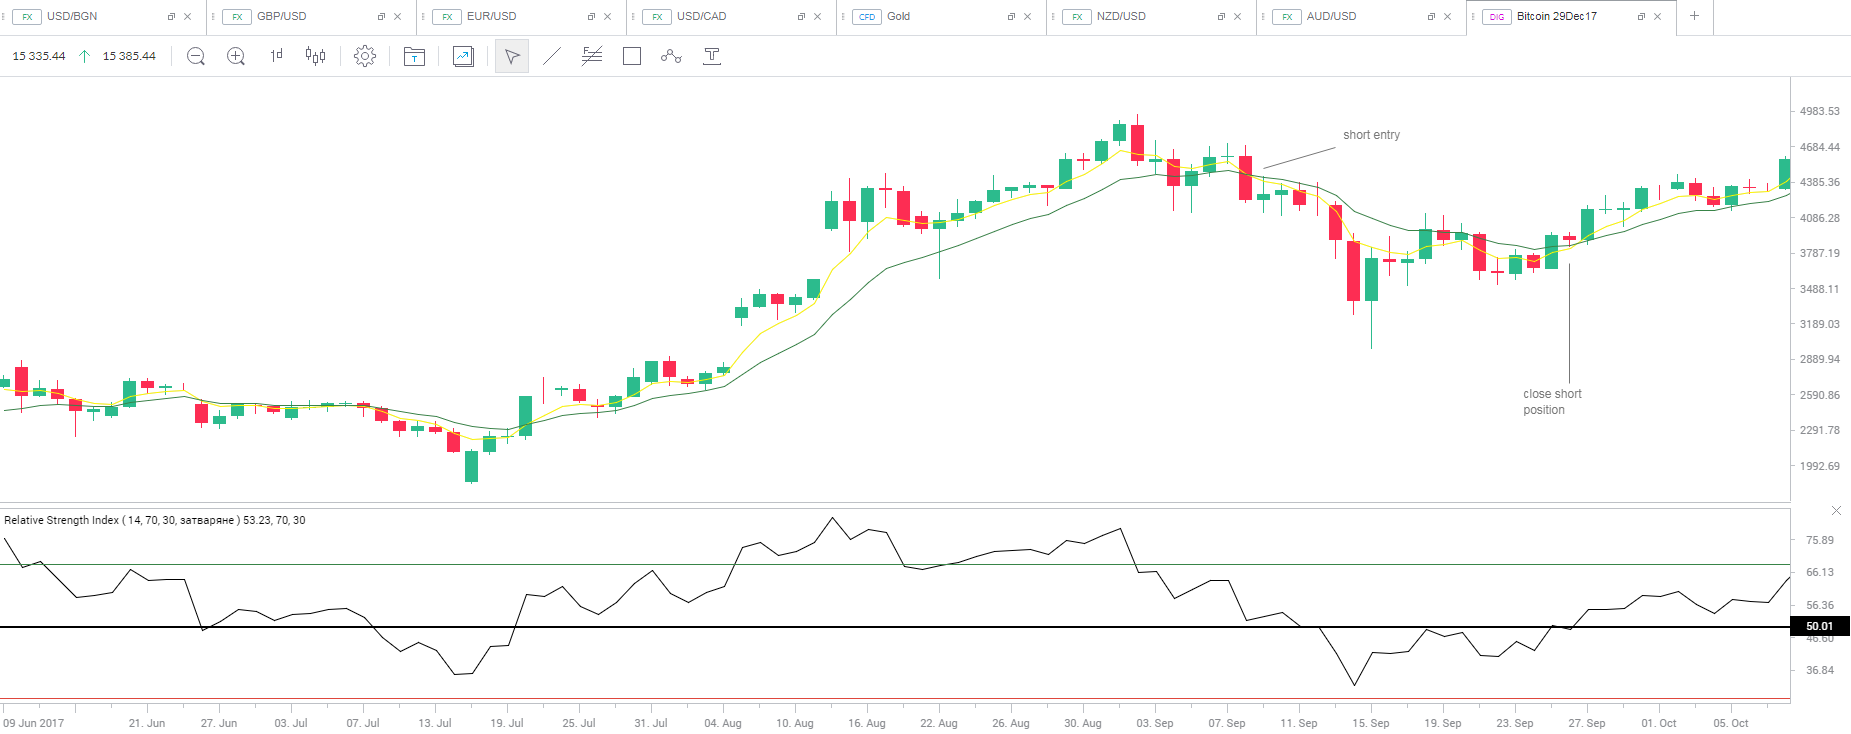
On the other hand, you will usually look to go short, when the 5-day EMA crosses the 12-day EMA from above to the downside, while the Relative Strength Index (RSI) has already crossed below its 50.00 level. You will look to close the short position, when the 5-day EMA crosses the 12-day EMA from below to the upside or the RSI moves above its 50.00 level. This is visualized on the chart below.
Strategy #2. Moving Average Sequence
 Now, let us take a look at a strategy, which swing traders may find useful. It is based on a specific sequence, or order, formed by several moving averages with different periods. In an uptrend, such a sequence forms when the 10-period Simple Moving Average (SMA) is at a higher price level compared to the 25-period SMA, which is at a higher price level in comparison with the 50-period SMA. In case we add two more SMAs – a 100-period and 200-period ones, then the 100-period moving average should be at a lower price level than the 50-period SMA, while the 200-period moving average should be at a lower price level compared to the 100-period SMA.
In a downtrend, such a sequence forms when the 10-period SMA is at the lowest price level and the 200-period SMA is at the highest price level.
What such a sequence indicates is a trending market environment and each one of the moving averages may be used as a level of support. Alongside the moving average sequence, you will need to pay attention to another technical indicator – the Average Directional Movement Index (ADX), and more specifically whether its reading is above 20 or not and if it is trending up (down) or not.
We should note that with this strategy it may be difficult to determine when to enter and when to exit the market. You may prefer to hold your position active as long as the above mentioned moving average sequence is still present and close the position as soon as the sequence is no longer in place. In any case, you should attempt to spot and take advantage of the sequence as soon as possible, because such a positioning of moving averages is not that common.
If we are to propose a sequence of steps, which should be followed for this strategy, then we should note that:
1. You need to detect the sequence of moving averages on the 4-hour price chart of Bitcoin;
2. You need to pay attention to the ADX and determine if it is trending up (for a long entry), or down (for a short entry) and if its reading has already exceeded 20;
3. You may open a long position (or a short position) in Bitcoin five candles after the respective sequence of moving averages appears for the first time and is still in place;
4. For long positions, you have to place a protective stop at the low of the trading day, when the initial moving average crossover occurs.
For short positions, you have to place a protective stop at the high of the trading day, when the initial crossover occurs;
5. You should close the position, in case the specific order of moving averages is no longer in place.
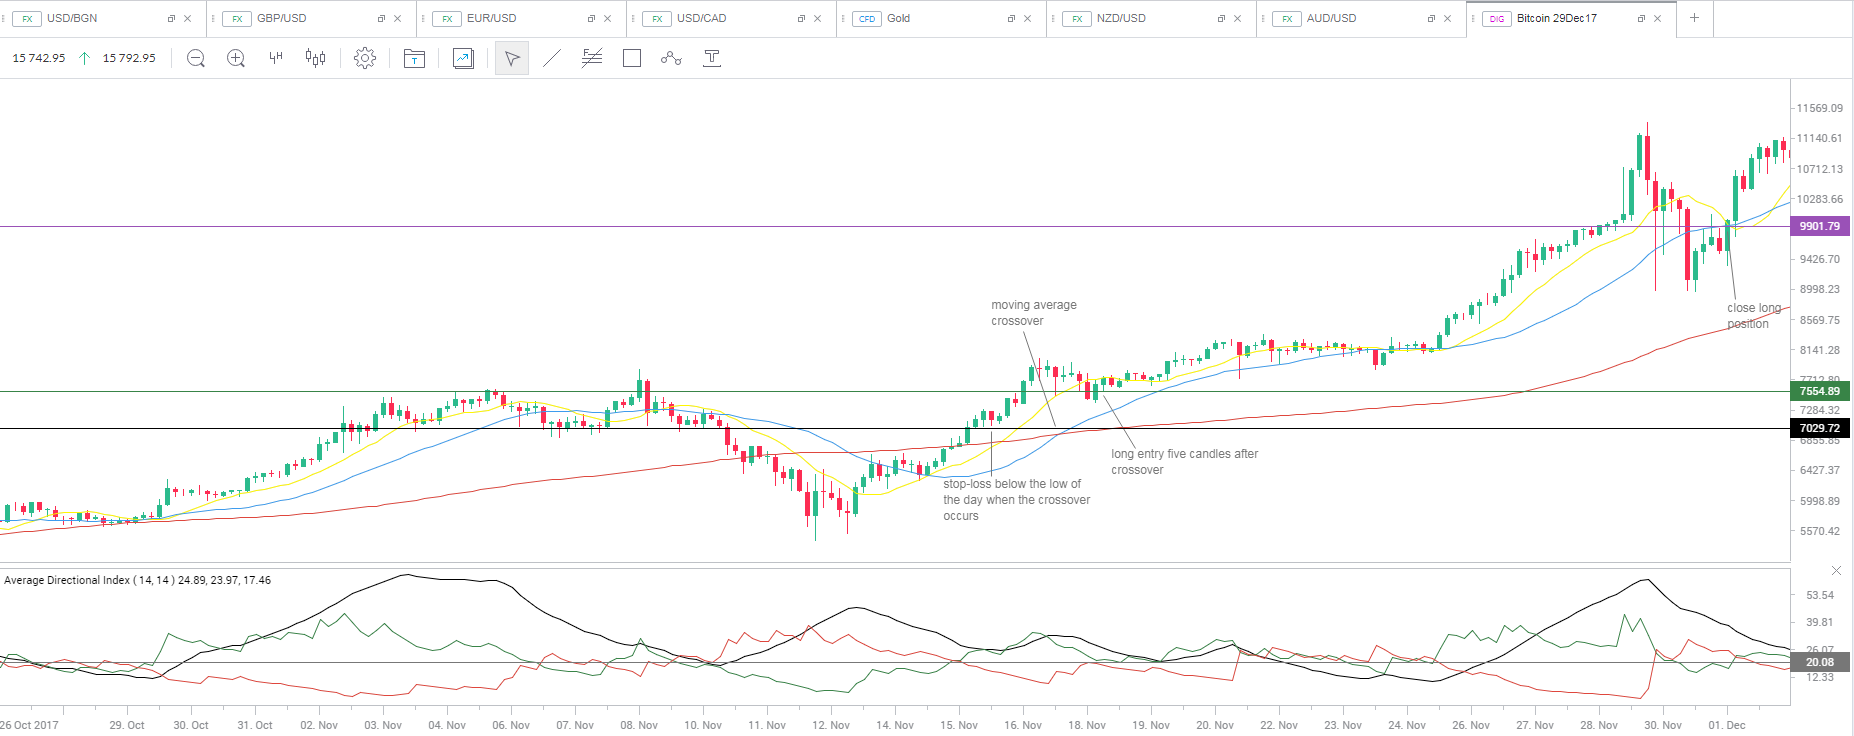
Let us take a look at the 4-hour price chart of Bitcoin. On November 14th the 10-period SMA (yellow) crossed the 25-period SMA (blue), but still none of them has crossed the 100-period SMA (red). Thus, no specific sequence has been formed yet. On November 16th the 10-period SMA and the 25-period SMA crossed the 100-period SMA in a bottom-up manner and the specific order was formed. The ADX reading (the black line below) has already moved above its 20.00 level, thus, all conditions for a long position in Bitcoin were met. Our long entry was made five candles after the order formation, at a price of $7,554.89. Additionally, we placed the protective stop for this trade just below the low of November 16th, at a price of $7,029.72. Finally, we closed the long position as soon as the specific order was no longer in place – when the 10-period SMA crossed the 25-period SMA in a top-down manner, which occurred on November 30th. Profit generated was $2,346.90 per coin.