Trading via the Accumulation/Distribution Indicator
You will learn about the following concepts
- Basics of Accumulation/Distribution indicator
- Calculation formula
- Interpretation and example
This is a volume indicator which attempts to measure supply and demand for a currency pair by determining whether investors are generally accumulating or distributing the pair. It is a variety of the more commonly used On Balance Volume. It is based on the assumption that volume may be a leading indicator to price action.
The Accumulation/Distribution indicator tracks the relationship between opening and closing prices, combined with volume. Here is how the formula looks like:
[((Close – Low) – (High – Close)) / (High – Low)] * Periods Volume = A/D
 If prices close higher than they opened, it means that bulls overcame bears and A/D is positive, and vice versa. Respectively, if prices closed at the days open, then it was a draw and A/D is zero. The larger the spread between the opening and the close price relative to the daily range (high to low), the greater the change in the indicator.
However, only a portion of the daily volume is attributed to the winning party. If the daily range is 10 cents, but the close is only 5 cents above the open, then only a half of this days volume is credited to the winning party.
Changes in the A/D indicator bring more value to trading than its absolute level. For example, if the market is on the rise, people tend to eye the new highs, often disregarding the underlying developments. If at the same time the market opens higher but closes lower, A/D will decline, signaling that the bull trend is weaker that it would seem. The same logic applies to the reverse scenario.
The significance of the open and close lies in the information these two price levels contain. The open reflects everything that has happened since the previous close while the market was inactive – news, shifts in sentiment etc. As for Forex, due to its decentralization the market operates around the clock, but it closes during the weekend. This makes the open on late Sunday particularly important because a lot of events might have occurred during those two days. Closing prices reflect the events and sentiment which have shaped the trading day and are especially important for the daily settlement of trading accounts.
Trading from the open is often dominated by amateurs, while professionals traders are active through the whole day and especially into the close. Thus, A/D reflects the battle between amateur and professional traders. If it rises in value, then the days close is higher than the open since professionals are more bullish than amateurs. If A/D declines, then the close is below the open as professional traders are more bearish than amateurs.
Trading principles
A/D is best traded on the basis of divergences with the price. If the market rallies to a new peak, while A/D marks a lower high, it generates a short signal as it implies professional traders are selling the rally. Conversely, if the market is marking a lower low, while the indicator reaches a higher low, the bullish divergence generates a buy signal as professional traders are buying into the dip. Check out the following example.
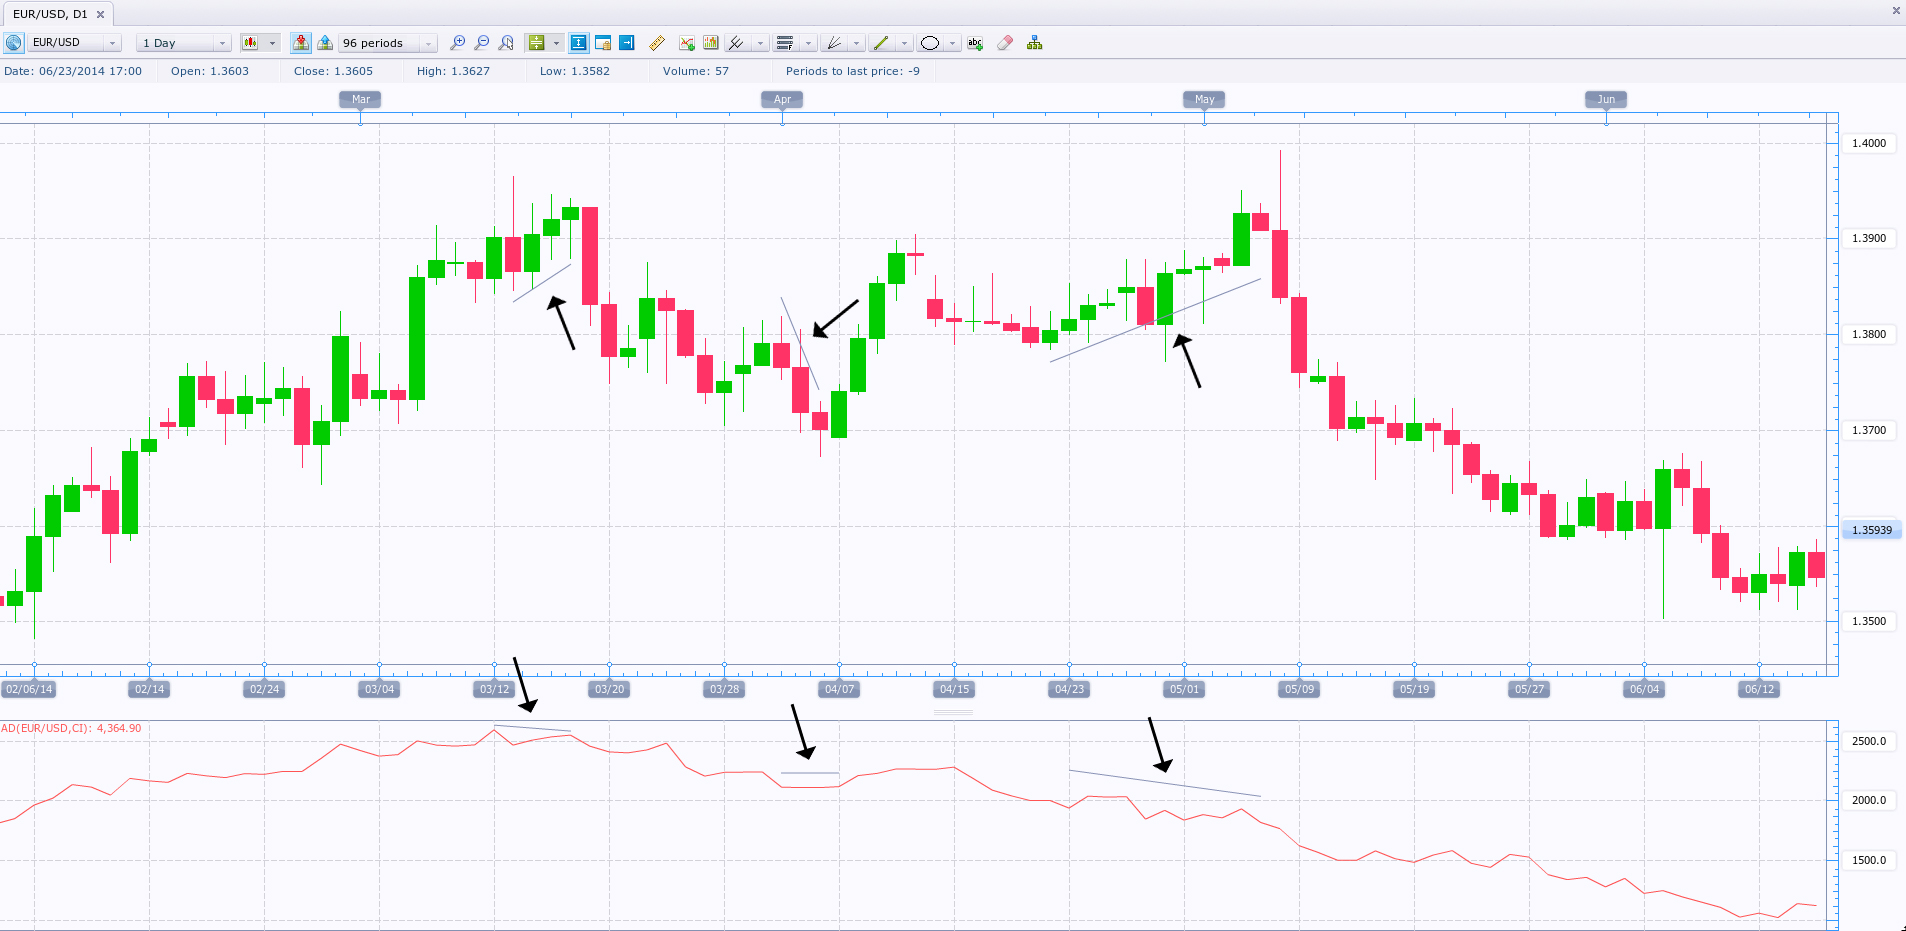
On the screenshot above you can see several major areas where the market movement and the A/D indicator diverged, which were followed by a price reversal. You cant use A/D solely as a method for decision making, but, thanks to its predictive value, it is a very handy tool that can be combined with other indicators and certainly improve your trading strategy.