Combining Average Directional Movement Index and EMAs
You will learn about the following concepts
- Average Directional Movement Index
- EMAs
- How to combine them
In Trading Pedia Forex Trading Guide we acquainted you with the Average Directional Movement Index, the Parabolic SAR and a very easy-to-grasp trading strategy which combined the two of them. In the article “Forex Trading Strategy – Combining Moving Average Convergence Divergence and Parabolic SAR” we presented to you an alternative viable trading system. Now we will show you how you can combine the Average Directional Movement Index with Exponential Moving Averages to produce a yet another easy-to-use and reliable strategy.
 It can be used on a daily time frame, or smaller, although the former may yield better results. It includes the combination of two EMAs – a 3-period and a 10-period one, coupled with a 14-period Average Directional Movement Index with Positive and Negative Directional Indicators (+DI and -DI).
The logic behind this strategy is simple. Because moving average crossovers are effective as signal generators only in trending markets, we use the ADX to determine the trends strength. Thus, if the average directional movement index is showing the existence of a strong trend (ADX is above the 20-25 area), you may proceed entering according to the EMA crossover signals.
Entry and exit spots are fairly straightforward. A buy setup is presented when the 3-period EMA crosses the 10-period EMA from below and continues higher, while the +DI line is above the -DI line and the ADX line is above the 25 level. Conversely, a short setup is generated when the 3-period EMA crosses the 10-period EMA from above and continues lower, with the -DI line being above the +DI line and the ADX line is again above the level of 25. For further confidence in the pattern, you might want to wait for the ADX to be on a rising trend when entering the trade, not only for it to be above above 25.
Exit signal is generated when the 3-period EMA crosses back the 10-period EMA. Alternatively, you can use a trailing stop, based on a percentage or absolute pip value. Check out the following example.
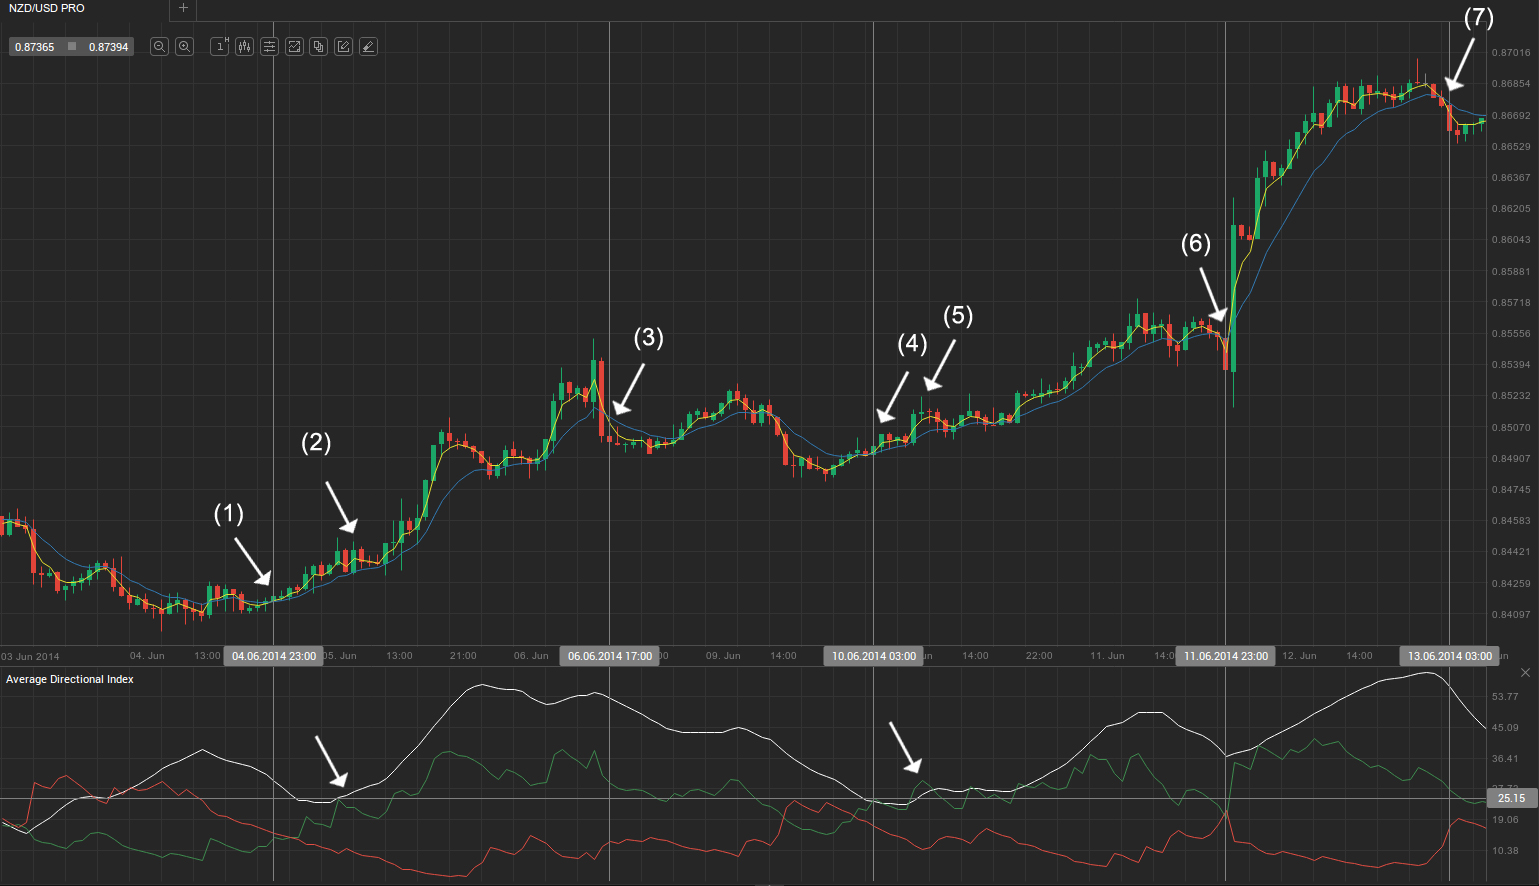
As you can see on the example above, the EMA crossover at (1) was not a very suitable entry at that time because ADX was declining. Instead, you could wait to see how market movement would continue after the crossover. A bull trend developed and we could enter at (2), at which point ADX was on the rise and exceeded the level of 25. We exit at the bearish crossover at (3) and refrain from entering short because we are unsure whether a bear trend would develop (always abstain from entering against a trend until solid evidence of a trend reversal is at hand).
The market made a pullback and the next bullish crossover was at (4). However, it was again unsupported by ADX, which flatlined little below the 25 level and so we decide to enter, if there is follow-through buying and the indicator accelerates past 25, which it did. We again enter long and exit at the (6) crossover. Although it was a minor crossover, watching it in real time would have produced an exit signal, unless you had used a wide trailing stop. Anyway, even if you had exited your position, you could re-enter long right after the immediate bullish crossover, at the close of the huge bull trend bar, and exit the long position at (7).