Forex Trading Strategy – a combination of RSI, EMA and candlestick setups
You will learn about the following concepts
- Indicators used with this strategy
- Signals to be looking for
- Entry point
- Stop-loss
- Profit target
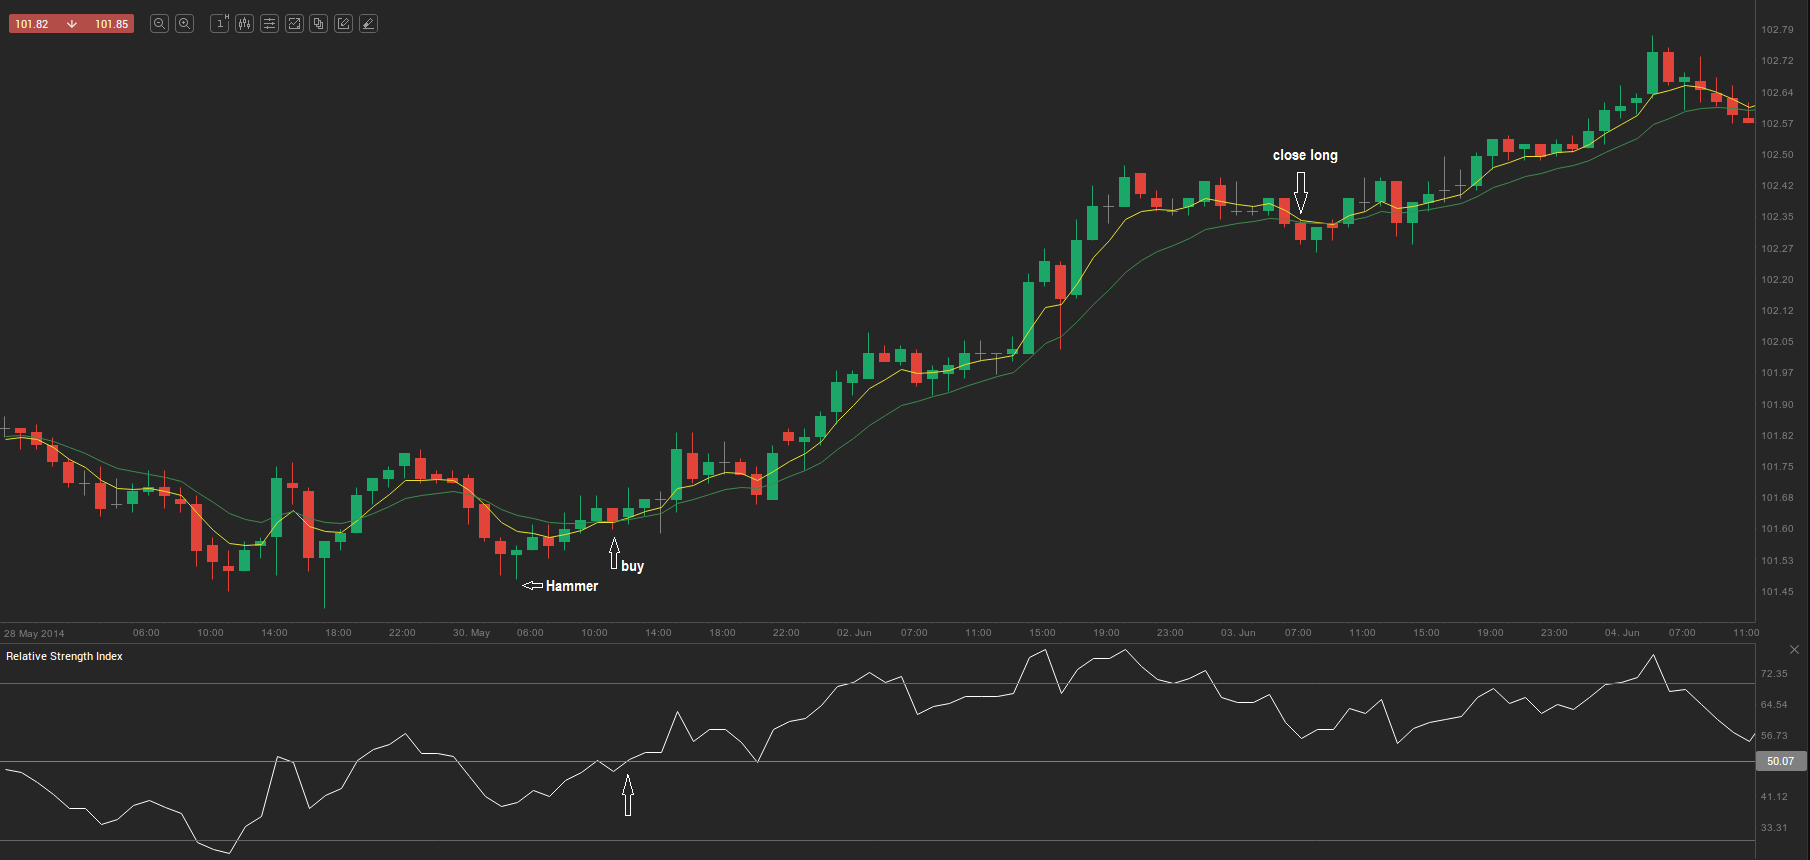
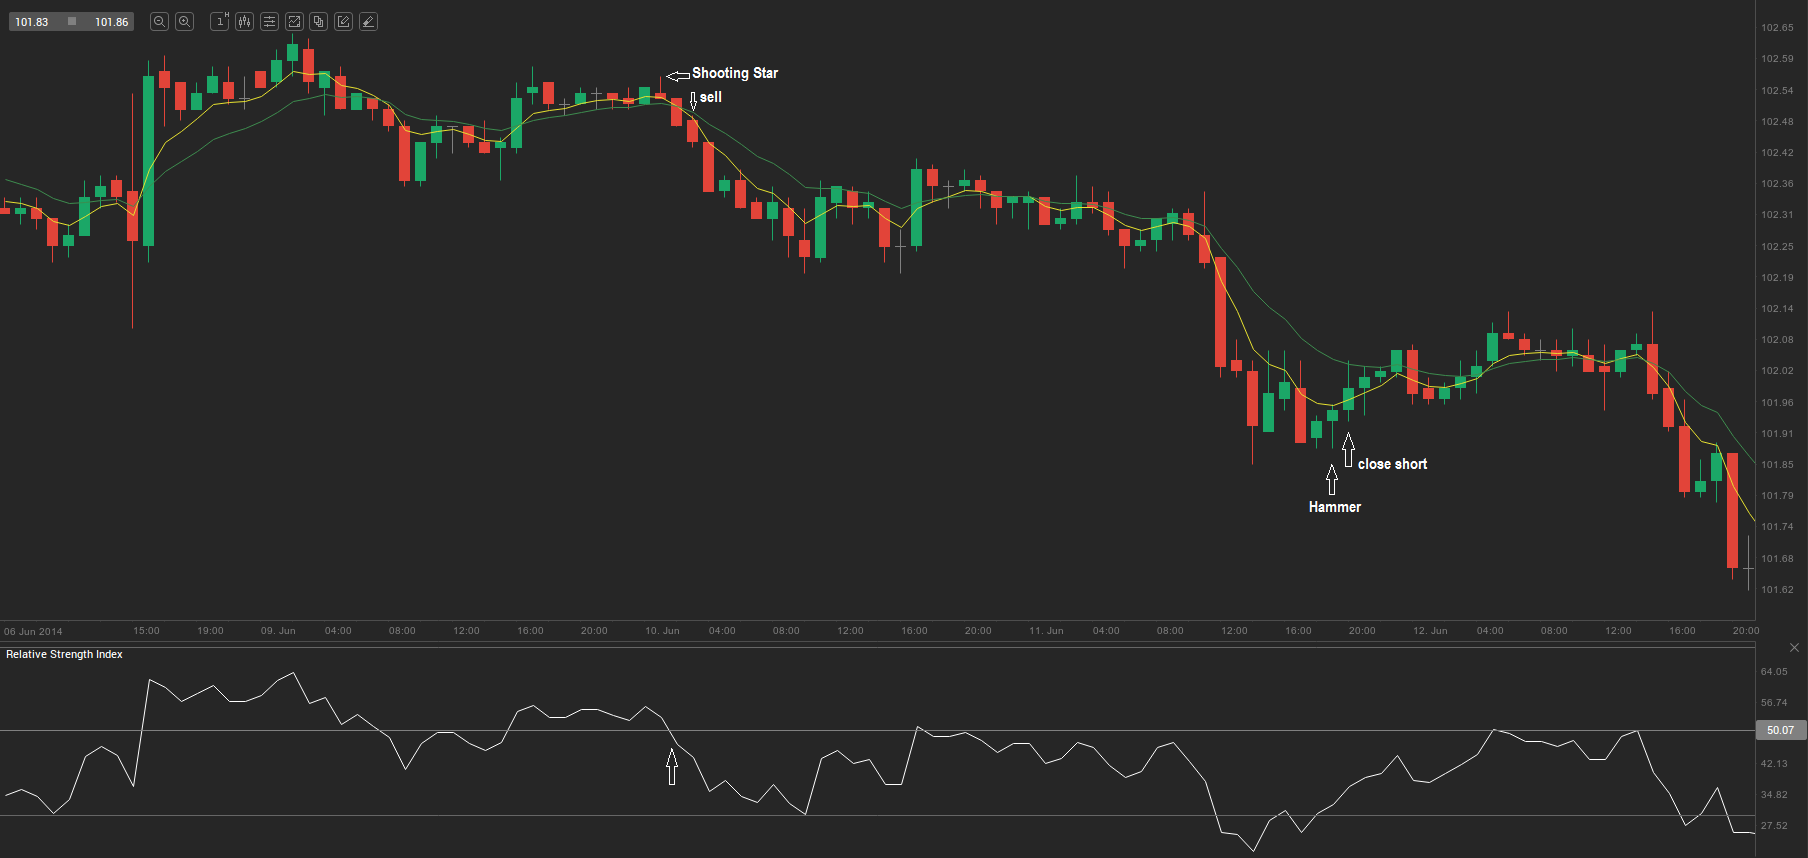
For this strategy we can use any time frame. Let us examine the 1-hour chart of USD/JPY. We will be using the following indicators: one 5-period Exponential Moving Average (EMA) (yellow on the chart below), one 12-period EMA (green on the chart below), the Relative Strength Index (RSI) with its period set to 21, overbought level – 70, oversold level – 30 and also candlestick patterns such as Hammer, Hanging Man, Inverted Hammer, Shooting Star, Bullish or Bearish Engulfing formation.
A trader will look to go long when: first, the 5-period EMA crosses the 12-period EMA from below to the upside, while the RSI reading is above the 50.00 level; second, a candlestick pattern such as a Hammer, or a Bullish Engulfing formation confirms the movement to the upside. The protective stop needs to be placed at the closest level of support.
The long position should be closed when: the 5-period EMA crosses the 12-period EMA from above to the downside, the RSI reading falls below the 50.00 level, or the market reaches and stagnates at a major level of resistance, trend line or other level of significance, or a Shooting Star/Bearish Engulfing formation appears.
A trader will look to go short when: first, the 5-period EMA crosses the 12-period EMA from above to the downside, while the RSI reading is below the 50.00 level; second, a candlestick pattern such as a Shooting Star, or a Bearish Engulfing formation confirms the movement to the downside. The protective stop needs to be placed at the closest level of resistance.
The short position should be closed when: the 5-period EMA crosses the 12-period EMA from below to the upside, the RSI reading jumps above the 50.00 level, or the market reaches and stagnates at a major level of support, trend line or other level of significance, or a Hammer/Bullish Engulfing formation appears.
Below we visualized a short trade and a long trade, based on this strategy.