Forex Trading Strategy – combining Exponential Moving Averages and Parabolic SAR
You will learn about the following concepts
- Indicators used with this strategy
- Signals to be looking for
- Entry point
- Stop-loss
- Profit target
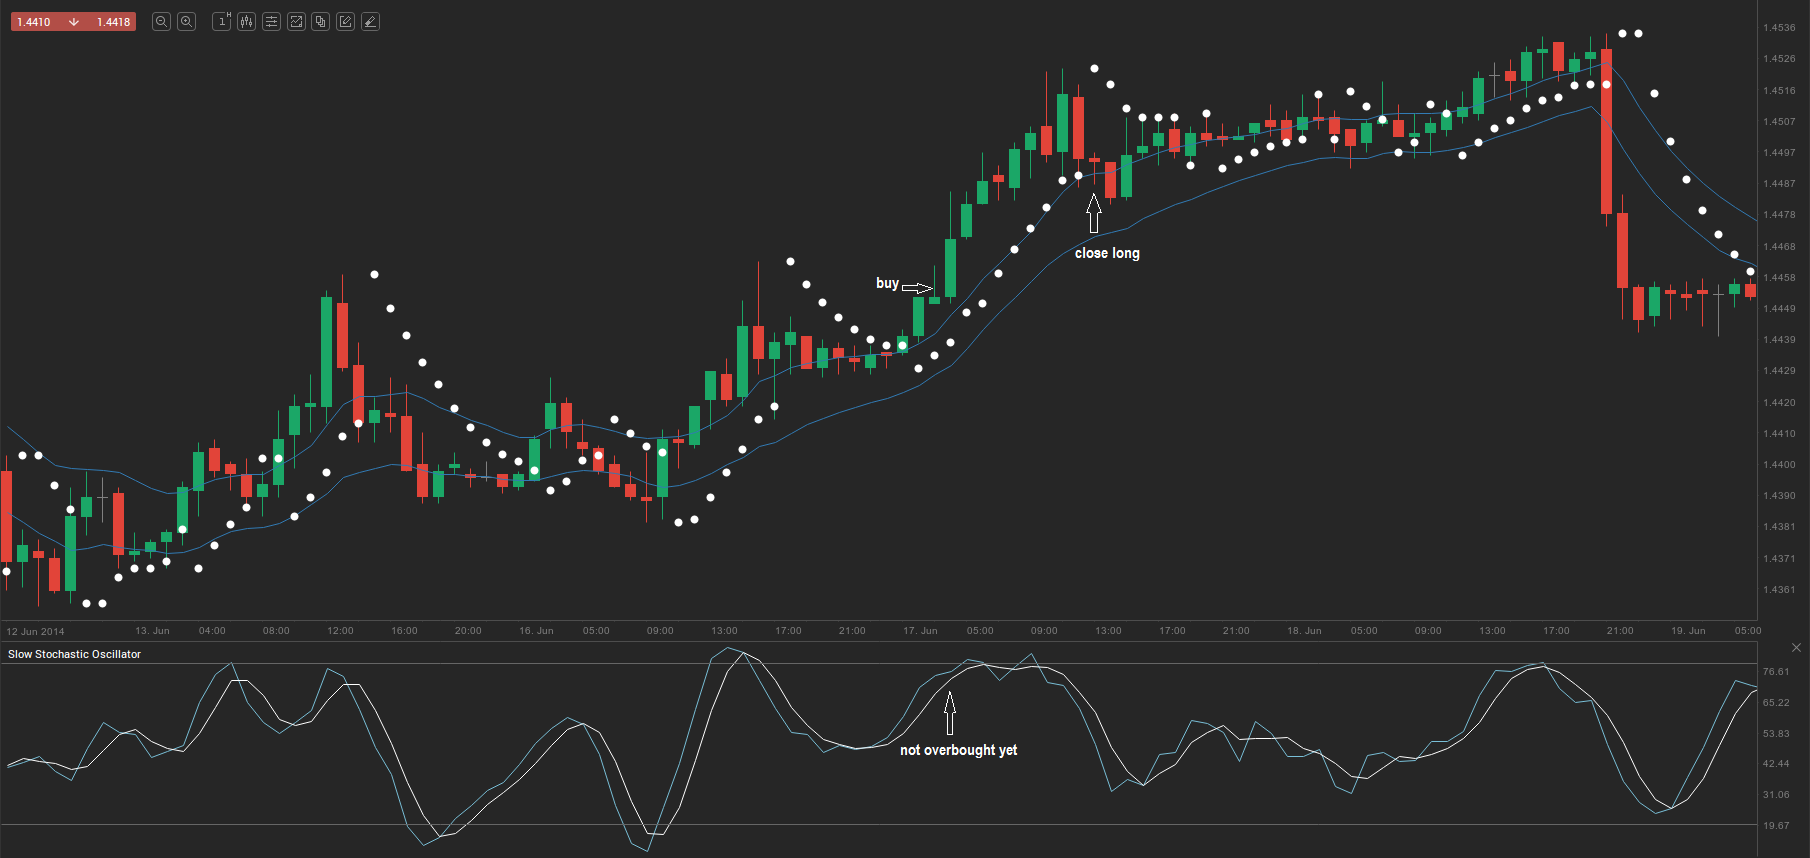
For this strategy we will be examining the 1-hour chart of EUR/AUD. The indicators we will be using are: a 14-period Exponential Moving Average (EMA) set to high (blue on the chart below), a 14-period EMA set to low (also blue in color), the Parabolic SAR with default settings (0.02; 0.2) and the Slow Stochastic Oscillator with settings 5,3,3.
As soon as a candle closes above the 14-period EMA (high), the Parabolic SAR positions under the candle and the Slow Stochastic is not overbought, this is a setup to go long. A trader may set a trailing stop at the 14-period EMA (low). Once the Parabolic SAR changes its position, the trader needs to exit.
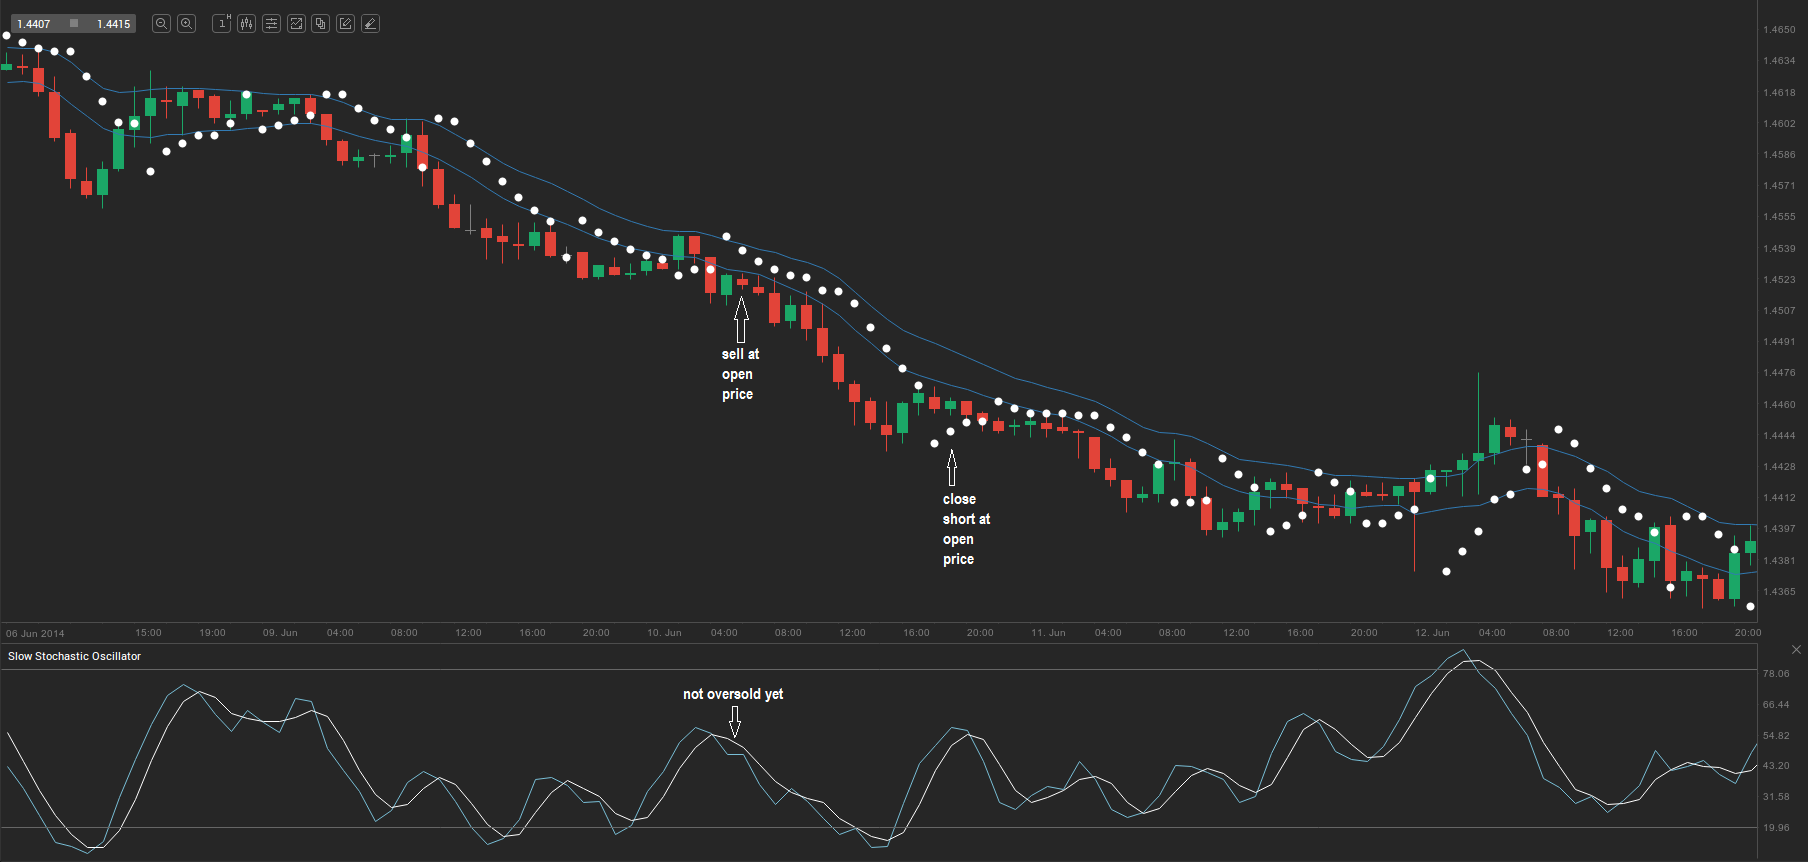
As soon as a candle closes below the 14-period EMA (low), the Parabolic SAR positions above the candle and the Slow Stochastic is not oversold, this is a setup to go short. A trader may set a trailing stop at the 14-period EMA (high). Once the Parabolic SAR changes its position, the trader needs to exit.
Below we visualize one long and one short trade, based on this approach.