Forex Trading Strategy – breakout of the “first four-candle range”
You will learn about the following concepts
- Indicators used with this strategy
- Signals to be looking for
- Entry point
- Stop-loss
- Profit target
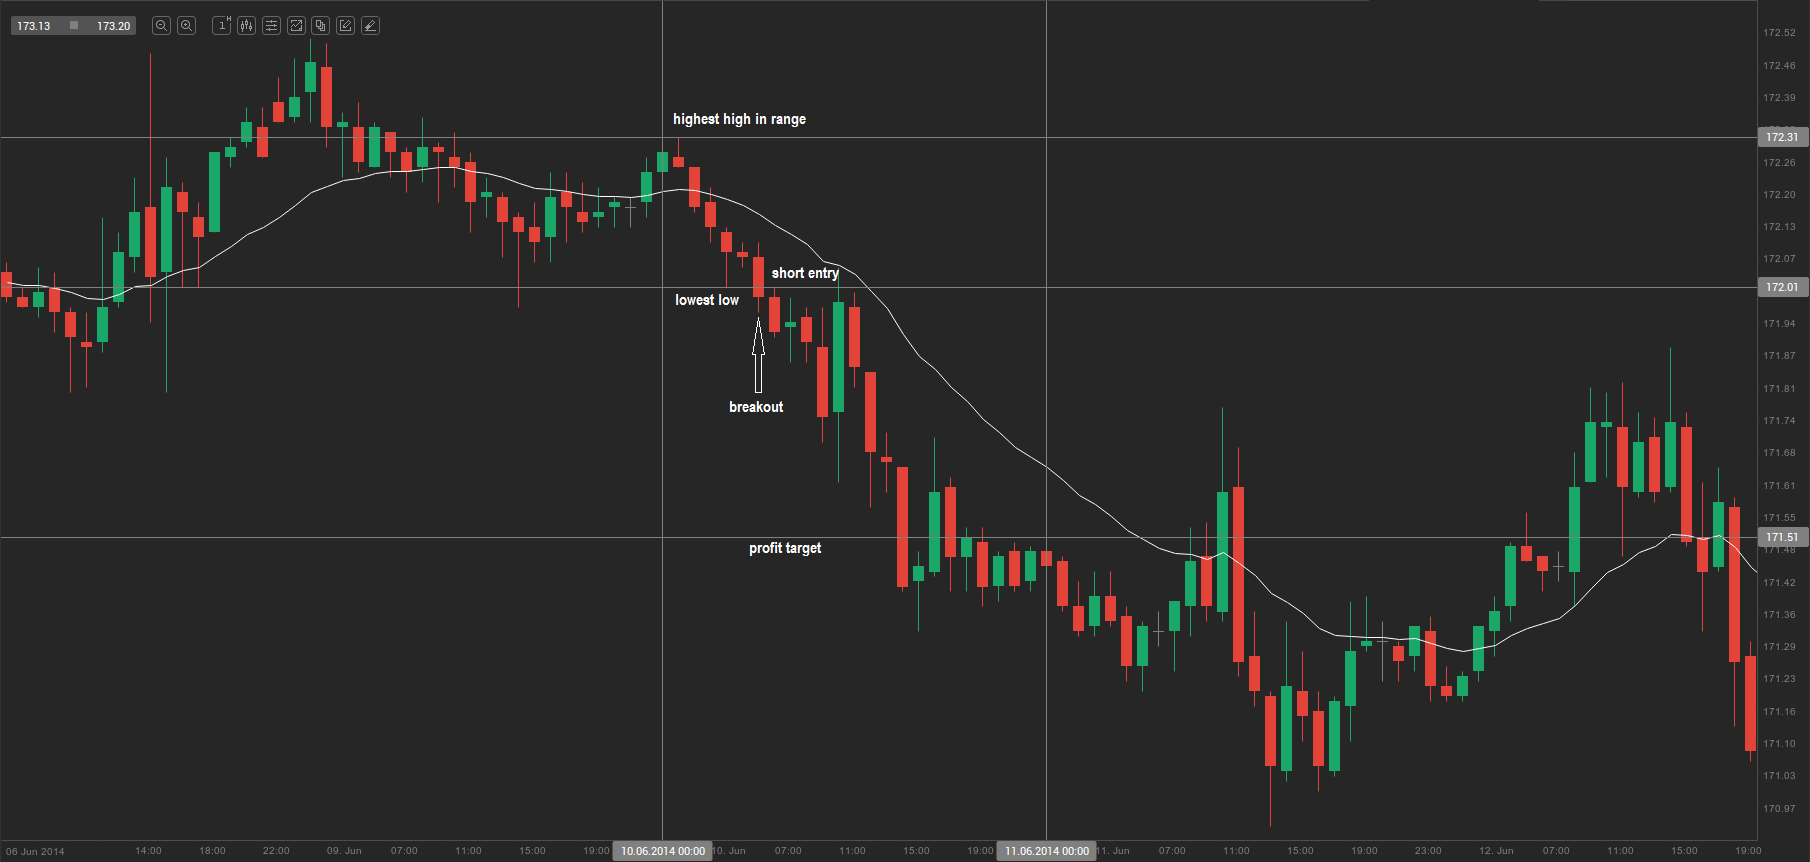
For this strategy we will be examining the 1-hour chart of GBP/JPY. First, a trader needs to draw one horizontal line through the highest high and one horizontal line through the lowest low of the first four candles during the trading day (in our case this is June 10th 2014). Next, the trader is to wait for an actual breakout of one of the two horizontal lines to occur.
As soon as a breach of one of the horizontal lines occurs, the trader will need to switch to a lower time frame (5 minutes, for example) and make sure that the entire body of the 5-minute candle has formed outside the respective horizontal line.
How to confirm an actual breakout in this case? In order to go long, the trader needs to make sure that the 5-minute candle closes above the upper horizontal line, after which a pullback occurs (the next candle should turn the upper horizontal line into a level of support). In order to go short, the trader needs to make sure that the 5-minute candle closes below the lower horizontal line, after which a pullback occurs (the next candle should turn the lower horizontal line into a level of resistance).
Once the trader has confirmation that the breakout is real, he/she will make his/her entry. The protective stop will be placed at the upper horizontal line for a short position and at the lower horizontal line for a long position. The profit target may be set to 50 pips away from the entry.