Forex Trading Strategy – the Bladerunner
You will learn about the following concepts
- Indicators used with this strategy
- Signals to be looking for
- Entry point
- Stop-loss
- Profit target
 The only technical indicator we will be using for this strategy is the 20-period Exponential Moving Average (EMA). The strategy is suitable for any time frame and any currency pair. We will be using the 5-minute chart of USD/SEK. The name, Bladerunner, is given, because the 20-period EMA “cuts” the price in two like a blade. In case the price is above the EMA and retests it, it is probable that the market may continue up. In case the price is below the EMA and retests it, it is probable that the market may continue down.
In case the price is above the EMA, a traders bias will be long, so he/she will probably be looking for the price to drop and hit the EMA, bounce from it and then move to the upside. However, if the price moves through the EMA and closes well below it, the trader may consider that it has probably changed its polarity, while the bias is now also changed to short.
In case the price is below the EMA, a traders bias will be short, so he/she will probably be looking for the price to advance and hit the EMA, bounce from it and then move to the downside. However, if the price moves through the EMA and closes well above it, the trader may consider that it has probably changed its polarity, while the bias is now also changed to long.
 In order to make an entry in the market, a trader needs to take into account two important moments:
First, the price must break out from a trading range before the entry, or it needs to be trending;
Second, the price must then retest the EMA successfully. What does that mean? If the price is currently below the EMA, it needs to bounce from it and remain below it and vice versa. What is more, the first candle, which comes into contact with the EMA must close on the same side of the moving average as it came near it from. Once this occurs, the trader will consider this candle as a signal candle. Next, he/she will wait to see if the following candle will confirm this move. If the following candle indeed continues to distance from the EMA, then it provides confirmation. Some traders, however, may need additional confirmation before taking the trade (for instance, a popular candlestick formation to occur).
In addition, a trader may feel safer entering into a position, when he/she has more than one reason to trade (for instance, not only a bounce from the EMA. It is better, if this occurs also at a prior support or resistance level, or at a pivot point).
When going long:
First, the trader may place two stop orders to buy, while the entries should be 2-3 pips above the candle, which provides confirmation;
Second, the protective stop may be placed 2-3 pips below the signal candle, which came into contact with the EMA;
Third, the profit target on the first stop order should be set at a distance, which equals the risk in pips. In case the risk for this position is 25 pips, then the profit target for the first order needs to be also 25 pips;
Fourth, the profit target on the second stop order should be set at a distance, which equals double the risk in pips. The risk is 25 pips, therefore, the profit target for the second order needs to be 50 pips.
When going short:
First, the trader may place two stop orders to sell, while the entries should be 2-3 pips below the candle, which provides confirmation;
Second, the protective stop may be placed 2-3 pips above the signal candle, which came into contact with the EMA;
Third, the profit target on the first stop order should be set at a distance, which equals the risk in pips. In case the risk for this position is 25 pips, then the profit target for the first order needs to be also 25 pips;
Fourth, the profit target on the second stop order should be set at a distance, which equals double the risk in pips. The risk is 25 pips, therefore, the profit target for the second order needs to be 50 pips.
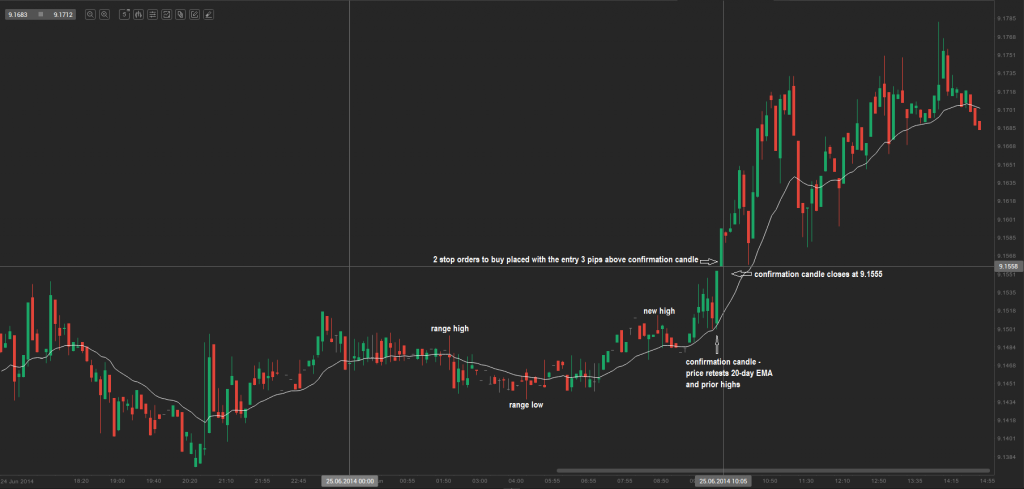
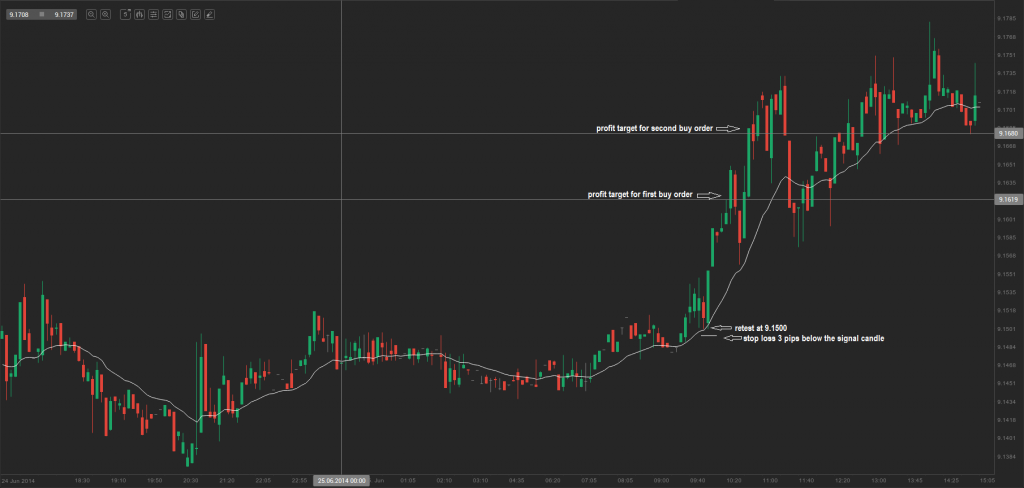
Let us take a look at the 5-minute chart of USD/SEK below. After the start of the trading day on June 25th we began looking for the range high and range low. Eventually the price broke out from the range and reached a new higher high. Next, we anticipated a successful retest of both the 20-period EMA and the prior range high. This occurred at 9.1500 (the middle-sized bear candle on the chart, which we consider as a signal candle, as it closed on the same side from which it approached the moving average). The following bull candle confirmed the move to the upside, thus, it became the confirmation candle. It closed at 9.1555. The next step we took was placing two stop orders to buy, with the entry point being 3 pips above the close of the confirmation candle, or at 9.1558. The protective stop was placed 3 pips below the signal candle, or at 9.1497. So, the entry point at 9.1558 and the protective stop at 9.1497 created risk at the amount of 61 pips. The profit target on our first buy order was equal to the amount of pips risked (61 pips). Thus, we took profit at 9.1619. The profit target on our second buy order was equal to double the amount of pips risked (122 pips). Therefore, we closed our second position at 9.1680. The total profit on this trade was 61 pips + 122 pips, or 183 pips.