Forex trading strategy based on analyzing multiple time frames
You will learn about the following concepts
- Indicators used with this strategy
- Signals to be looking for
- Entry point
- Stop-loss
- Profit target
When trading it is possible to receive signals from different indicators, which seem to contradict to each other. If such a doubtful situation occurs, the best solution is to take a look at the larger picture. Thus, a trader will use a larger time frame. If he/she intends to position using the 1-hour time frame, then:
First, he/she should examine the larger time frame (1-day chart, for instance), in order to detect a trending behavior for a given instrument (a currency pair, a commodity, an index). The trader can draw a trend line using three swing points, use the Average Directional Index (ADX) to determine if there is a trend, examine moving averages with different periods and see if they form a proper sequence. Sometimes the trend will be visible without the use of technical indicators or trend lines. In case the instrument is in a bull trend, long positions are the only appropriate decision and in case there is a bear trend, the trader should make only short entries. In case there is no distinguishable trend, the trader should abstain from action using this method;
Second, having identified the direction in which he/she is willing to position in the market from the larger time frame, the trader will switch to a smaller time-frame chart in order to set his/her entry, exit and protective stop. If the trader has identified a bull trend on the 1-day chart, he/she can make a long entry if the price drops to a support level on the 1-hour chart. A long position can also be taken, if the Relative Strength Index (RSI), for instance, shows that the trading instrument is oversold on the 1-hour chart. Having made a long entry, the trader should place a protective stop below the support level or zone. If he/she has identified a bear trend on the 1-day chart, a short position can be taken at the level of resistance, or if the RSI shows the trading instrument is overbought on the 1-hour chart.
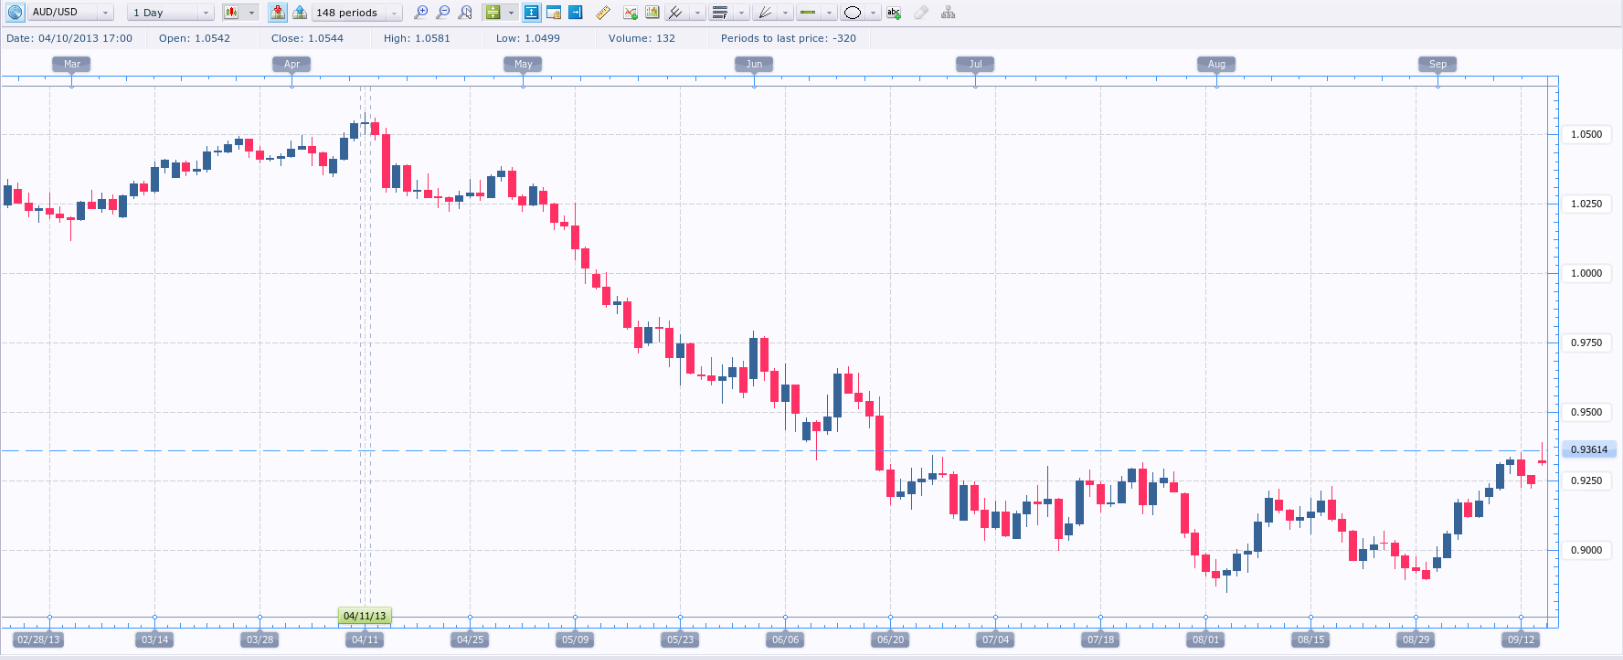
On the daily chart of AUD/USD below we first identified a bear trend.
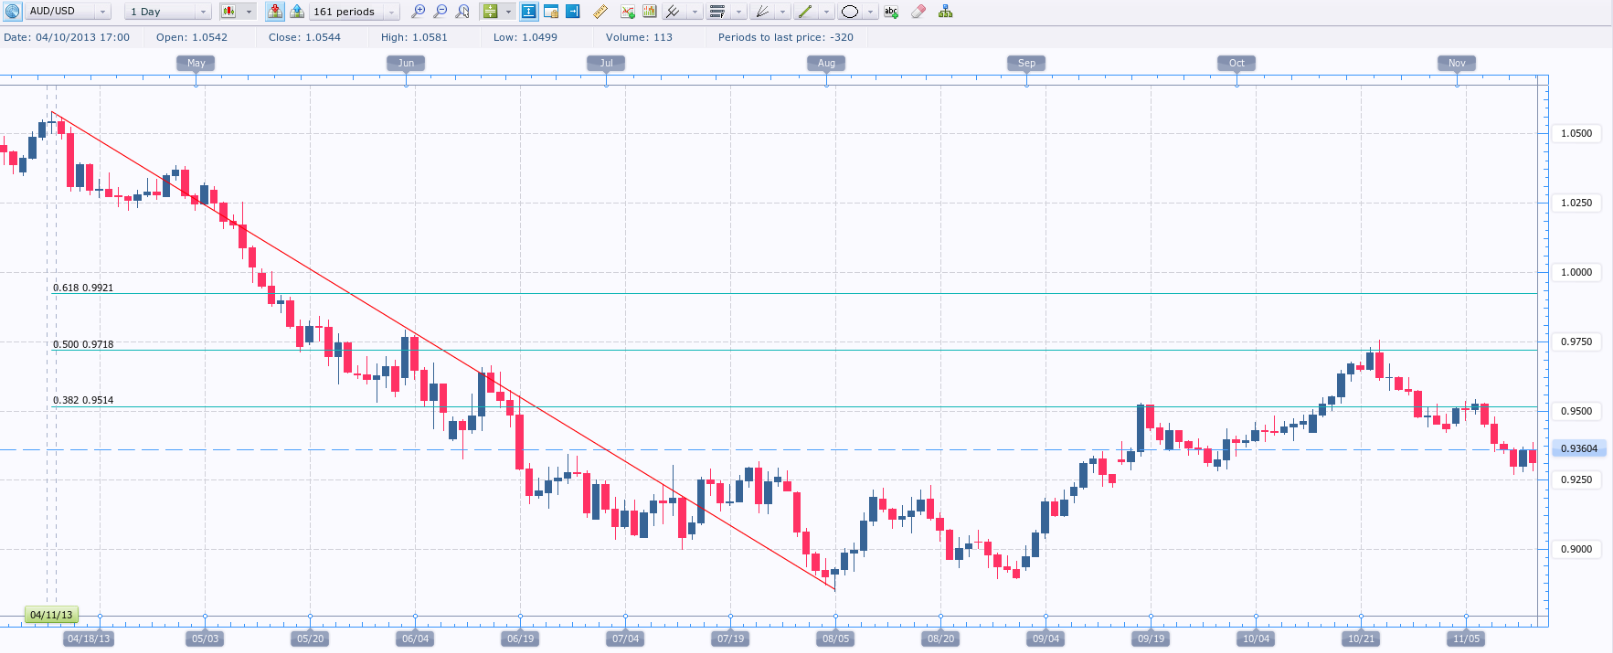
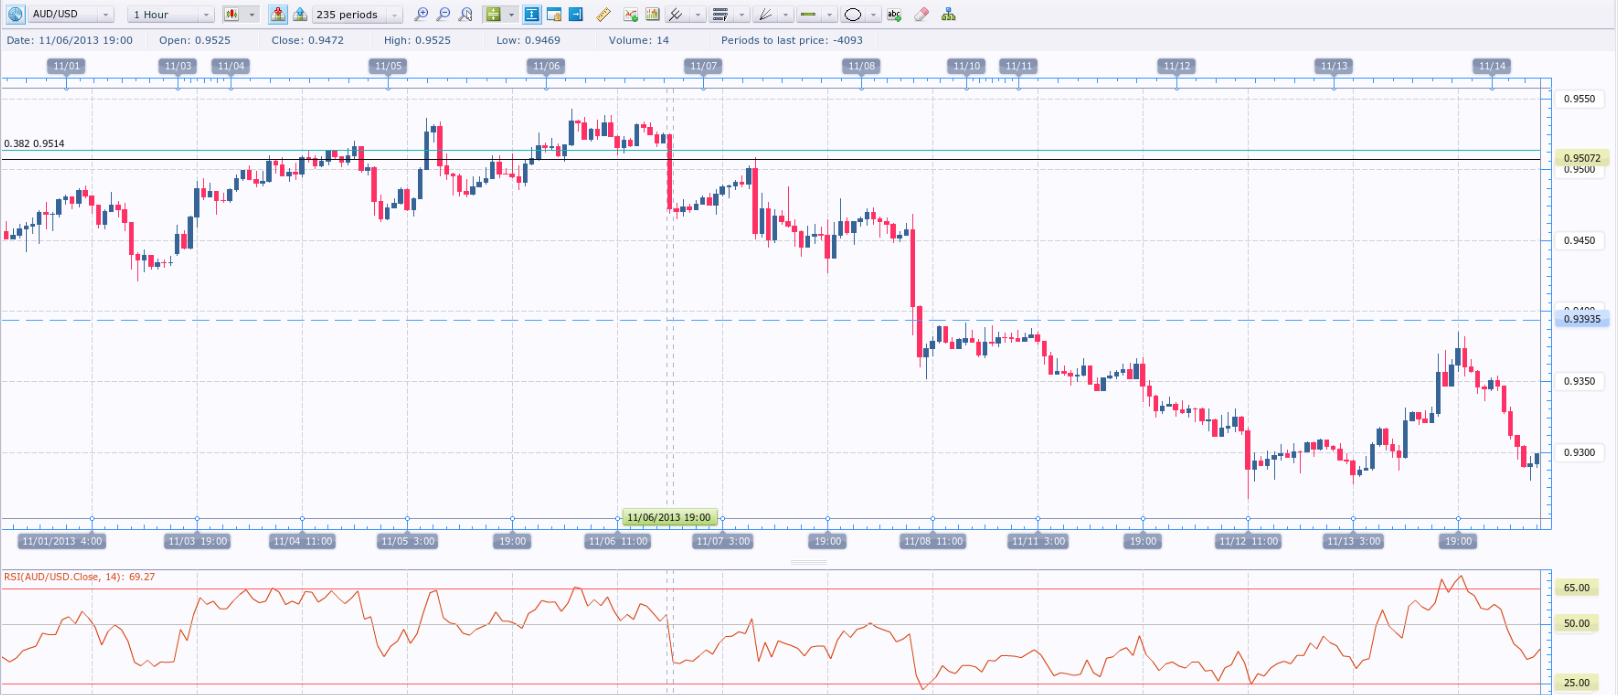
In case a major trend is showing signs of slowing down, the trader should use the Fibonacci retracement levels in order to identify where this trend will probably continue. In our case, we need to look for a level of resistance where we will make our entry. Our intention is to take a short position, so that once the trend reasserts itself, we will be positioned in consonance with the trend. We place the Fibonacci retracement from the high of April 11th down to the low of August 5th. As can be seen on the chart below, the 38.2% retracement of the recent bear trend is a potential entry point. What is more, this retracement level coincides with the area of 0.9514, which was an area of resistance several weeks ago (on September 18th and 19th).
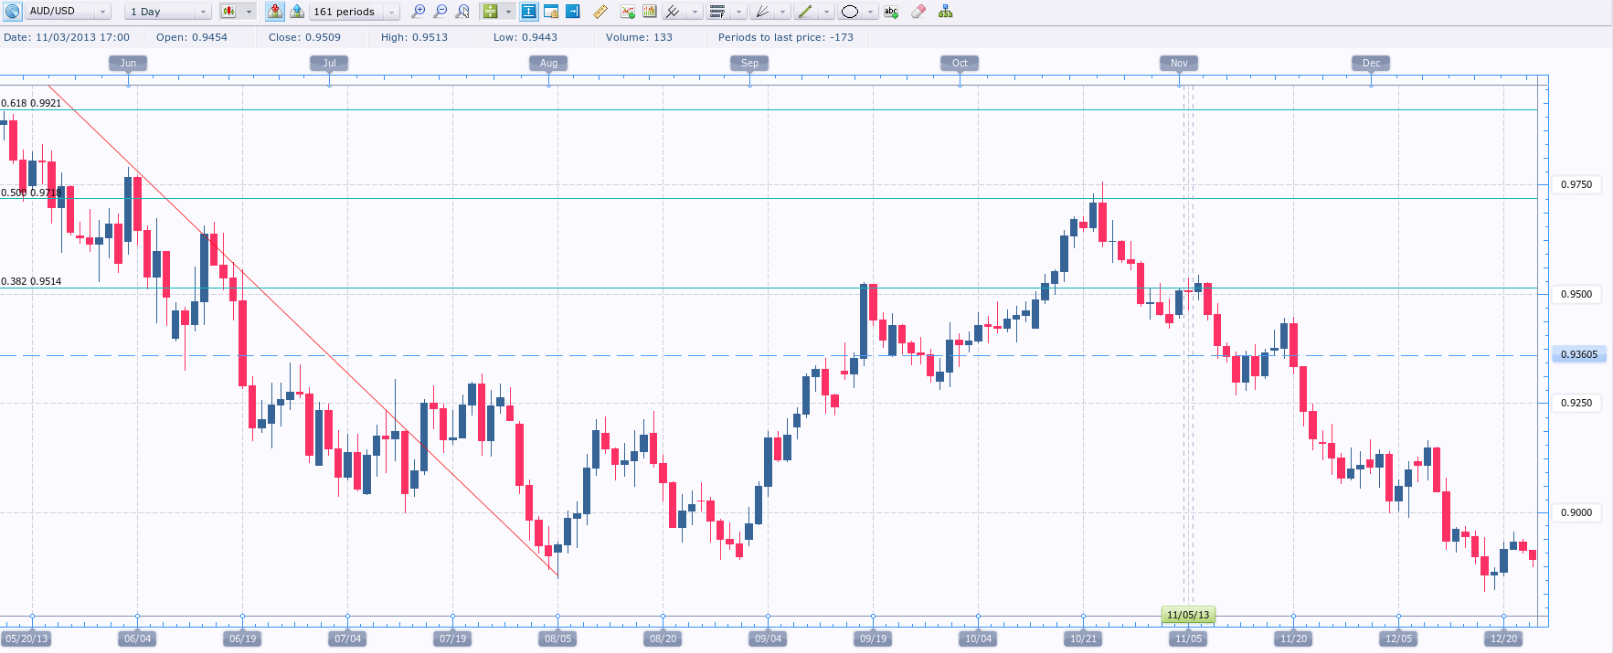
On November 5th AUD/USD reached the 38.2% retracement and traded at resistance. But, does that mean we need to make a short entry right away? Before the entry we switch to the 1-hour chart and begin to examine the Relative Strength Index in order to detect if it is in the overbought zone. The RSI was approaching the overbought level and on November 6th it breached it, after which fell back below it.
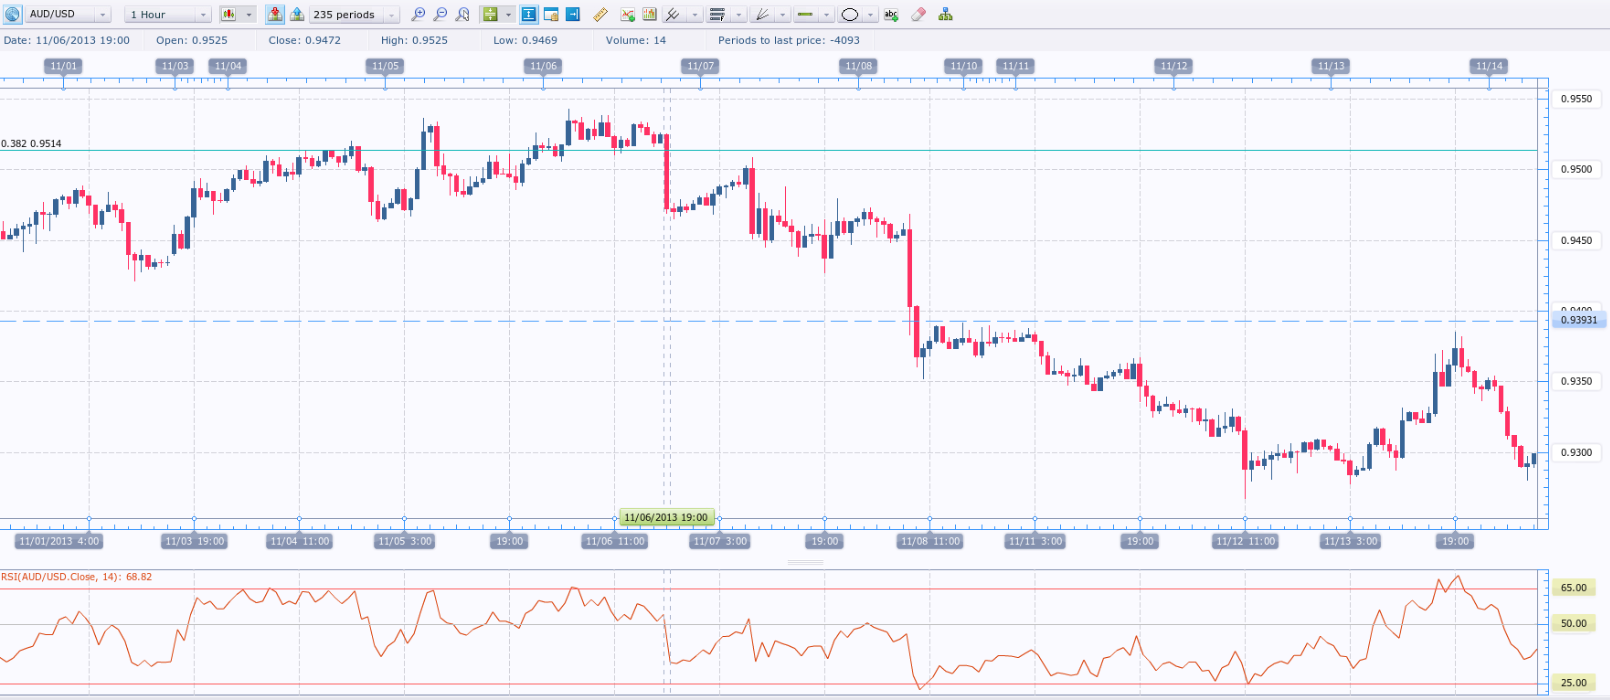
There are traders who will go short simply because the currency pair has become overbought. However, is this a sufficient circumstance to believe that the pair will not continue to surge? A currency pair or other trading instrument can always increase to even higher levels after a huge rally, or decrease to even lower levels after a huge drop. A trader must be aware that anything is possible after he/she has made an entry in the market! There is a way to increase the chance of success – with the use of oscillator. In our case a trader needs to wait for the oscillator to plunge below the overbought level into neutrality. This signifies a shift in momentum and a possible counter move.
However, waiting for the oscillator to change direction before the entry means that a trader will not enter at the absolute high. Lots of traders are willing to go short at the absolute high and go long at the absolute low, but this can be a perilous approach, because no one is able to forecast with precision the peaks and the bottoms in any trading instrument. Waiting for momentum to shift will not provide a trader with the opportunity to enter at the very high or low.
The entry, the stop loss and the profit target
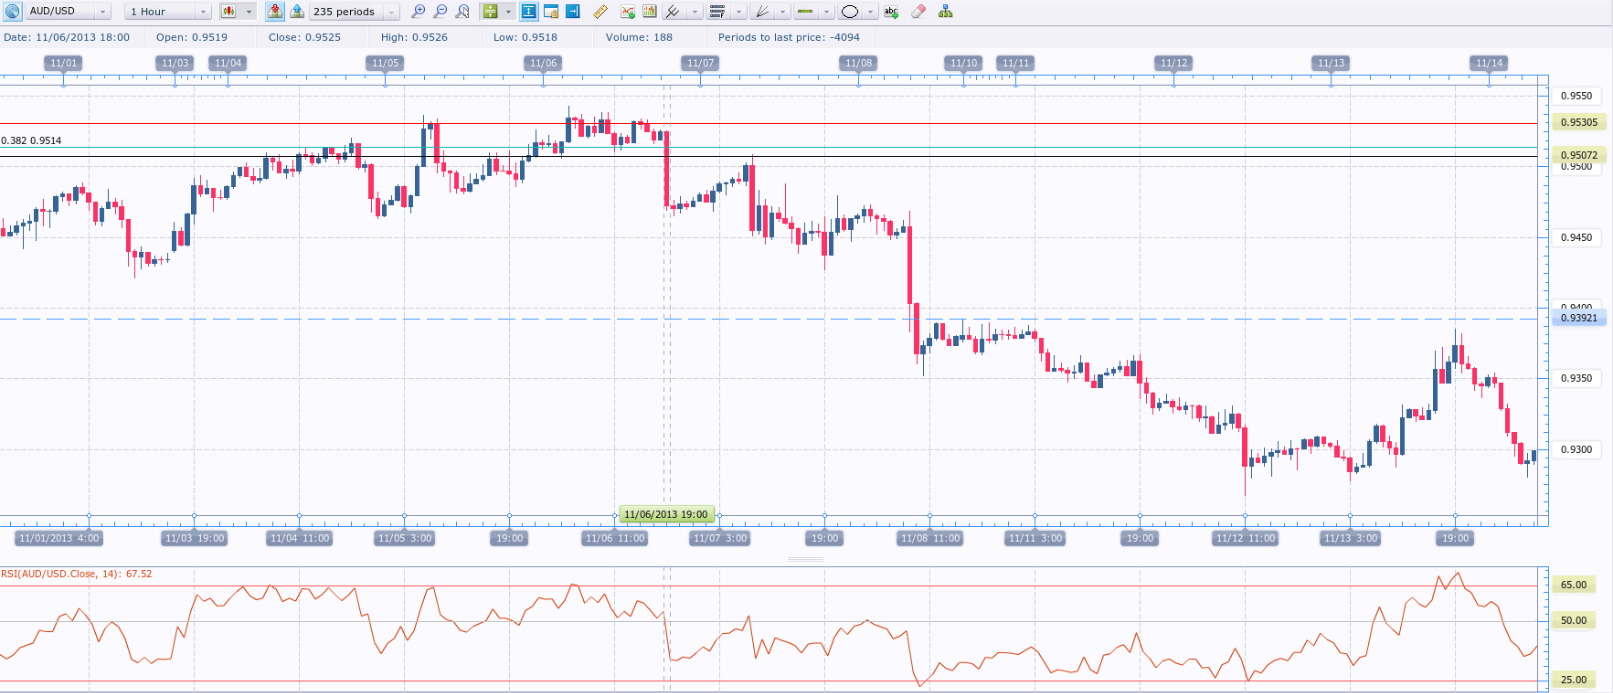
Let us go back to our example. As AUD/USD begins to fall and the RSI plunges below the overbought level we are now looking to make our short entry. This occurs at 0.9507 (black line on the chart below), a level where the RSI is no longer showing that the pair is overbought.
Next, we must place a protective stop right away in order to secure our position against unexpected movement in the opposite direction. First, we may choose to place the stop above the recent high of 0.9542. Imagine a scenario, in which AUD/USD continues to rally after we have already made our short entry. We certainly would not be willing to hold this position, if the currency pair climbs to a new higher high. If it indeed trades above 0.9542, it could simply be breaking out to the upside. Second, the 38.2% Fibonacci retracement is at 0.9514, which is a resistance level. So, we would like our stop to be placed above this level. And third, if we are more conservative and prefer a tighter stop, let us place it in the area between the recent high and the 38.2% Fibonacci retracement. We choose to place it at 0.9530 (red line on the chart below).
This way the entry point at 0.9507 and the stop loss at 0.9530 create risk at the amount of 23 pips. The final step is to identify the exit points. If we have two lots, we will close 50% of the trade at each exit. The first exit will be identified by measuring the risk of our trade (23 pips per lot). If the currency pair reaches the point, where we will be profitable by the amount of pips risked, then we can close a portion of the trade. So, the pair must fall to 0.9484 in order to provide us with a 23-pip profit. Our first exit will be at 0.9484 (light green line on the chart below).
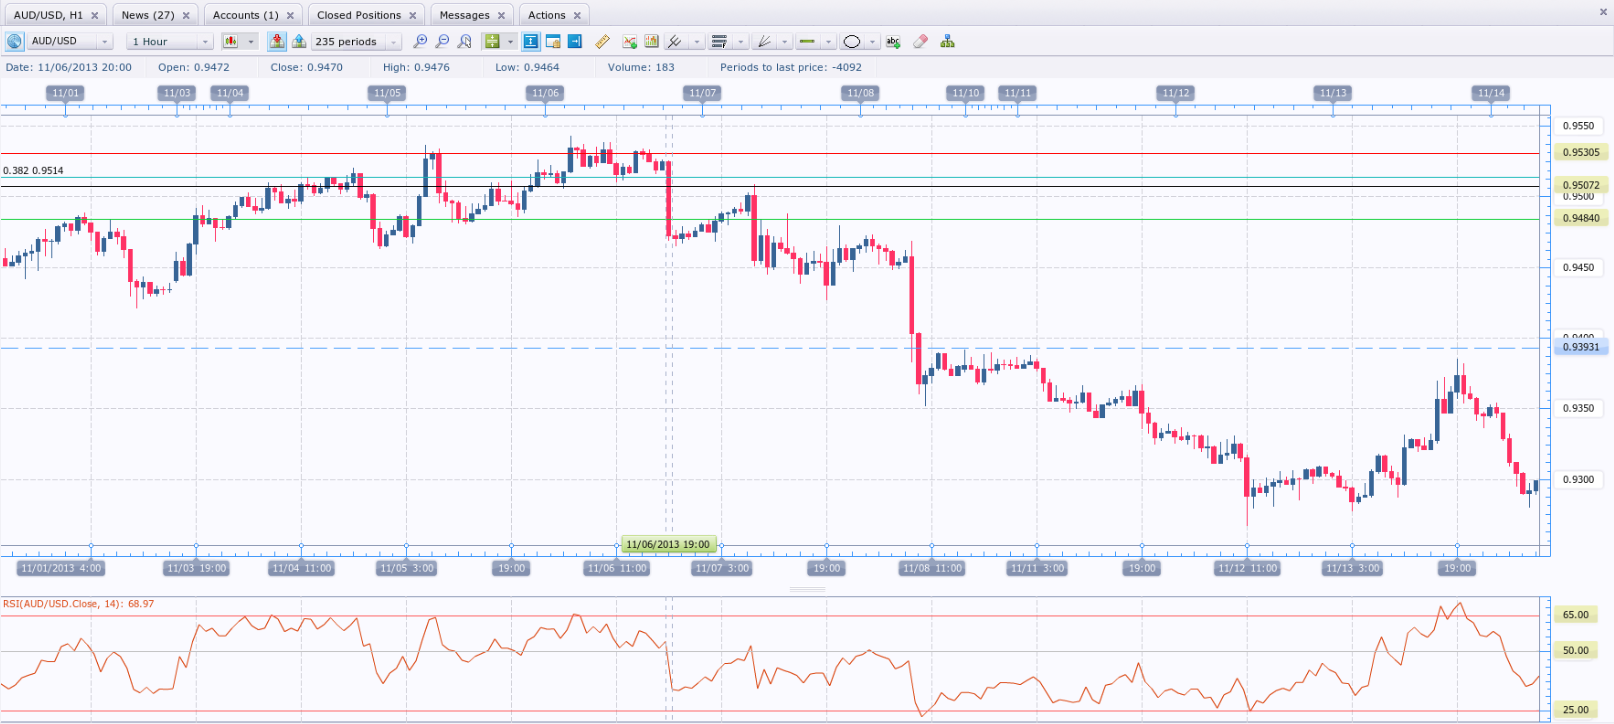
The second and final exit will be identified by looking for areas of prior support. If we look to the left side of the chart we will notice that the currency pair found previous support in the area of 0.9430. Thus, we decide to use 0.9430 (dark green line on the chart below) as our second and final exit. Our total profit on this trade is 23 pips + 77 pips, or 100 pips using two lots (50 pips average profit per lot).
