Using Moving Averages in conjunction with the ATR
You will learn about the following concepts
- Indicators used with this strategy
- Signals to be looking for
- Entry point
Trends are your best friends. We have said that multiple times and we will continue underscoring it, because it is simply true. The article you are about to read explains another trend-following trading strategy, which uses a 10-period Exponential Moving Average as the key support and resistance level to base your entry points on, in conjunction with slower EMAs for trend identification and the Average True Range for stop placement and adjustment.
We have spoken a lot about trends, trend lines, trend trading etc, so we will not waste much time here. If you want to read more, you can browse through Tradiing Pedia’s “Forex Trading Academy“, “Price Action Trading Academy” and “Day Trading Academy“.
The strategy we are about discuss is based on the broadly accepted idea that moving averages act as extremely strong support and resistance levels and because they are closely monitored and acted upon by institutional traders, not only individual ones, pullbacks to the MAs are reliable with-trend entry points. It works best on a higher time frame (hourly charts or larger). In our case, we will use a 10-period Exponential Moving Average in conjunction with an hourly time frame. Keep in mind that institutional investors are most active on the higher time frames, daily etc, so best results will most likely be achieved there.
As you know, as trend-following indicators, moving averages require a trending market in order to be effective. Apart from using indicators such as the Average Directional Movement Index (ADX) and other similar tools, we can count on the position of different moving averages to one another as a technique to determine trend direction.
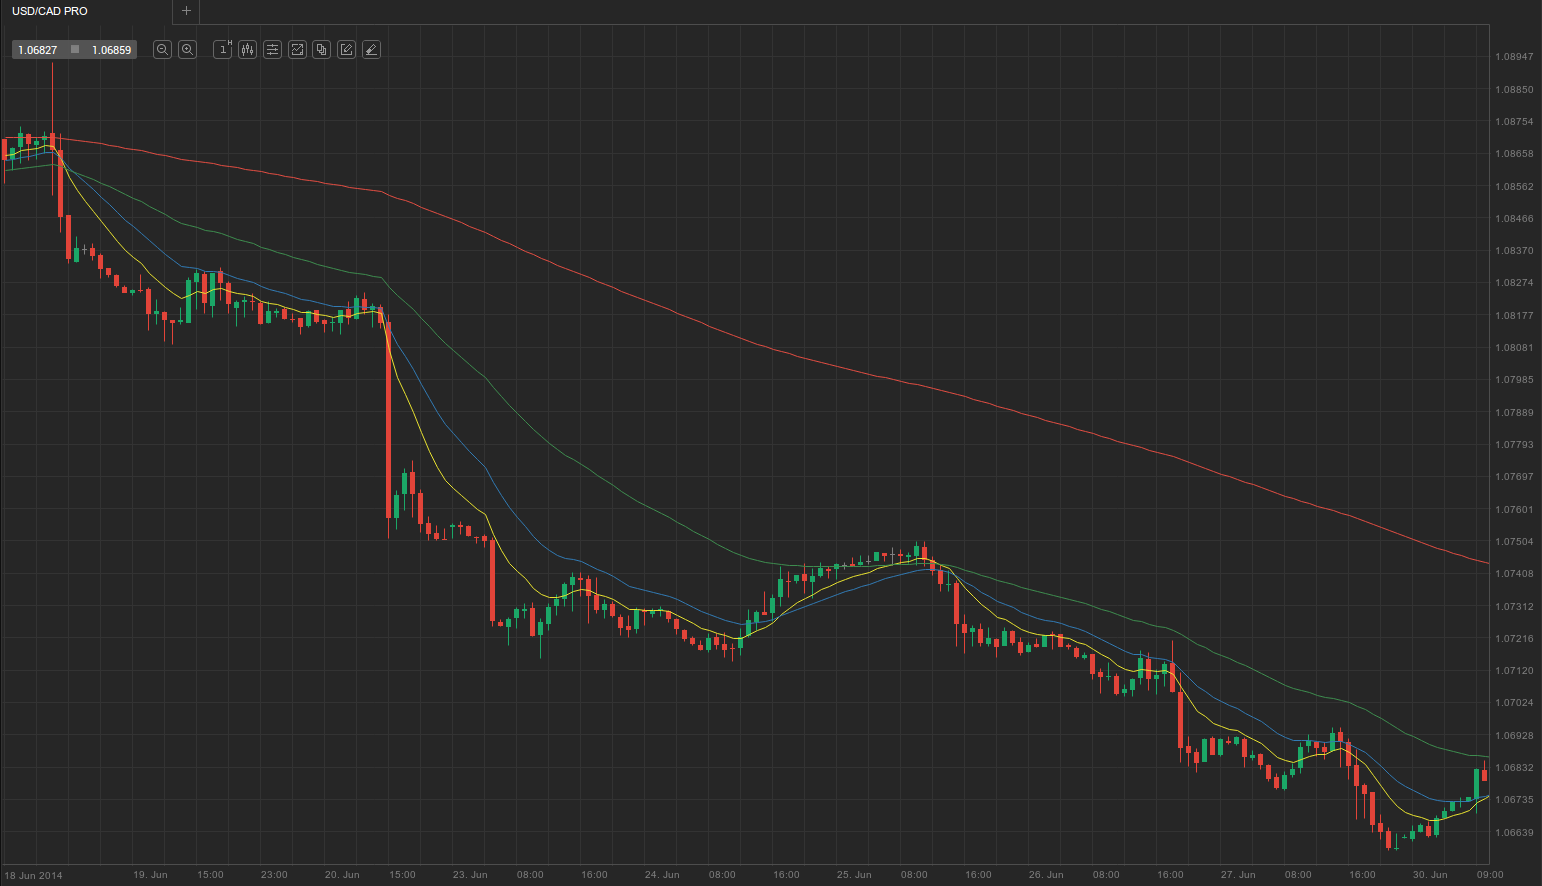
As you can see in the example above, the USD/CAD pair was in a very strong downtrend for the visualized period (the price ran the diagonal from the upper left hand corner to the lower right hand corner). Not only that, but the EMAs are in the right order indicating a strong downward movement. As you can see, the 10-period EMA (yellow) was the one closest to the price, acting as a resistance zone, except for a short pullback period between June 24th and June 25th. The 20-period EMA (blue) was above it, and the 89-period and 200-period EMAs (green and red respectively) were also properly aligned above the faster EMAs, confirming the strong bear trend.
However, the trading strategy we are about to use works only with the strongest of trends, thus, the proper alignment of multiple EMAs is not enough as single condition that needs to be met. In order to further filter weak or medium-strength trends from the most decisive ones, we will incorporate one last requirement – the 10-period EMA must have acted as an obvious support/resistance area for at least 10 bars.
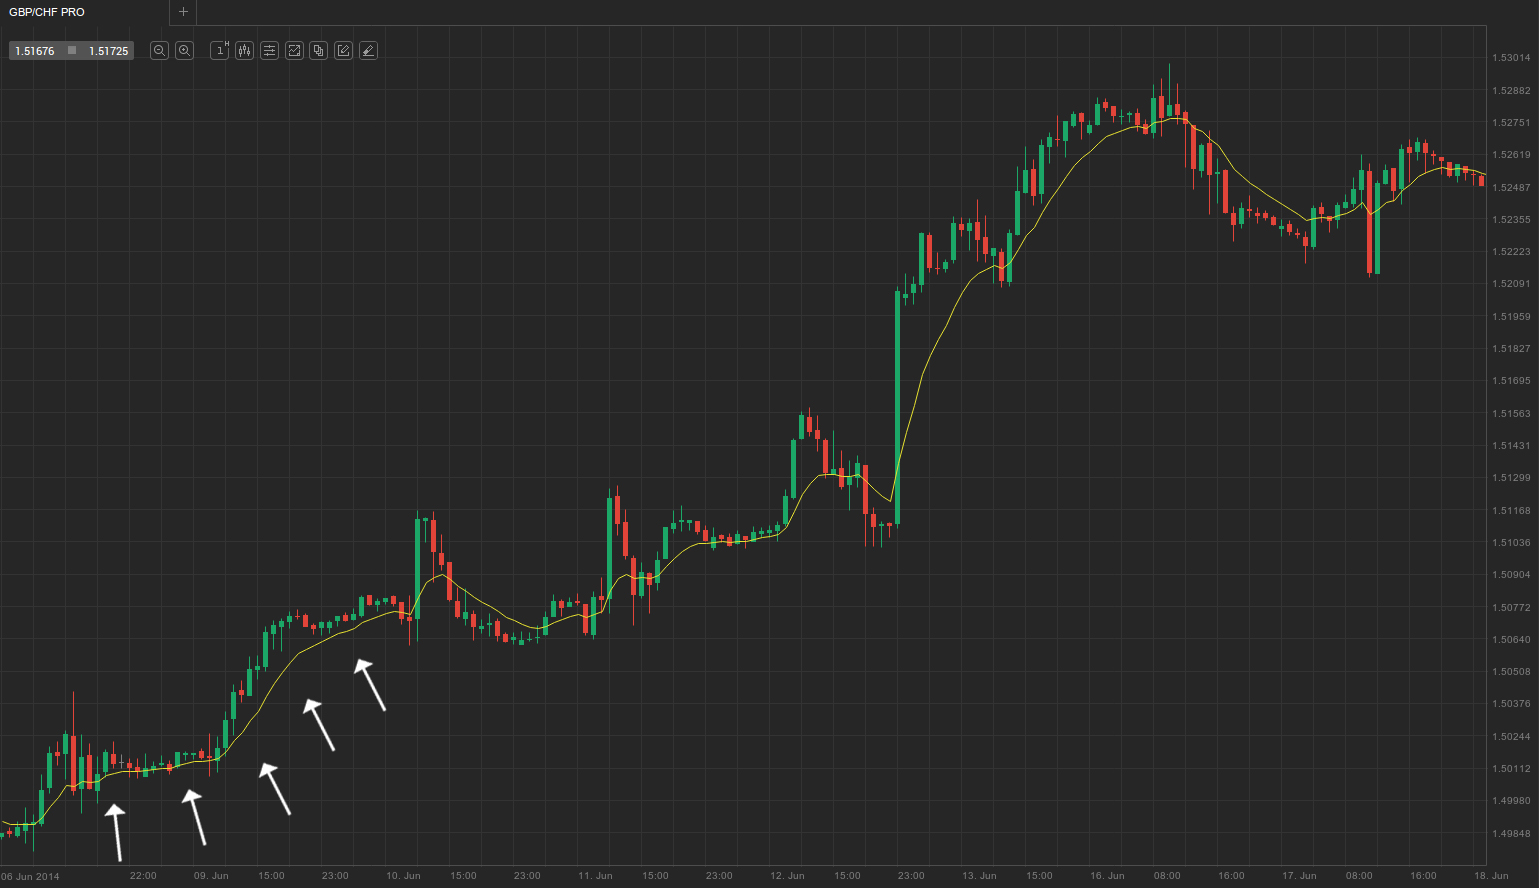
In the example above you can see how the market, which shortly before was in a trading range (not displayed), accelerated into a bull trend and the 10-period EMA acted as a strong support zone for the next almost 50 bars. This is exactly the type of trend we are looking for. If the price keeps bouncing from the EMA and continues to advance, it shows that institutional investors are buying into the dips and reflects their bullish sentiment (you definitely want to always be trading in the same direction as institutional market players). Very often such decisive trends are fueled either by major economic releases, such as the US non-farm payrolls, GDP growth etc, but also interest rate decisions, and especially when they create opportunities for carry trades. If you want to learn more about carry trades, read our article “Using Carry Trades to Maximize Profit“.