Trading Stochastic and RSI Divergences
This lesson will cover the following
- Slow Stochastic Oscillator
- Relative Strength Index
- Divergences between the two and the price
In the current article we will speak about two relatively similar trading strategies, one of which is based on divergences with the slow stochastic, while the other generates trading signals based on RSI divergences.
The first strategy combines the usage of the Average Directional Movement Index, 30-minute stochastic and five-minute stochastic. It can be used both to trade index futures, as well as Forex.
First, you need to determine the direction of the trend and its strength. Check the direction of the short-term trend by using the slow stochastic indicator on the 30-minute time frame. Its strength is determined via the Average Directional Movement Index, with either default trackback period or a modified one. If ADX is showing a strong trend, you should enter only with-trend positions.
Once we have attained the required information, we drop down to the 5-minute chart and a 21-period slow stochastic. Here we will look for entry signals generated by a divergence between the slow stochastic and the price. The divergences first point must be in the overbought or oversold level (80 and 20 respectively, but they can be modified according to market volatility – if the market is less volatile you can change them to 70-30 or 75-25). The second point of the divergence does not need to be inside an extreme area. Occasionally you can have three-point divergences, which are rarer but produce more probable signals. As the divergence occurs, you need to enter only, if it produces a signal in the direction of the larger time frame trend, as evident by the ADX.
Stop-loss order should be placed several pips below the most recent swing low (5-10 pips) for a long position, or above the most recent high for a short position. The stop must then be trailed as the market moves in your favor again to 5-10 pips below the next formed swing high or low, which is also accompanied by a new swing high or low in the stochastic.
You should exit the position when your trailed stop gets triggered or in case you are trading stocks, at the markets close. Check out the example below.
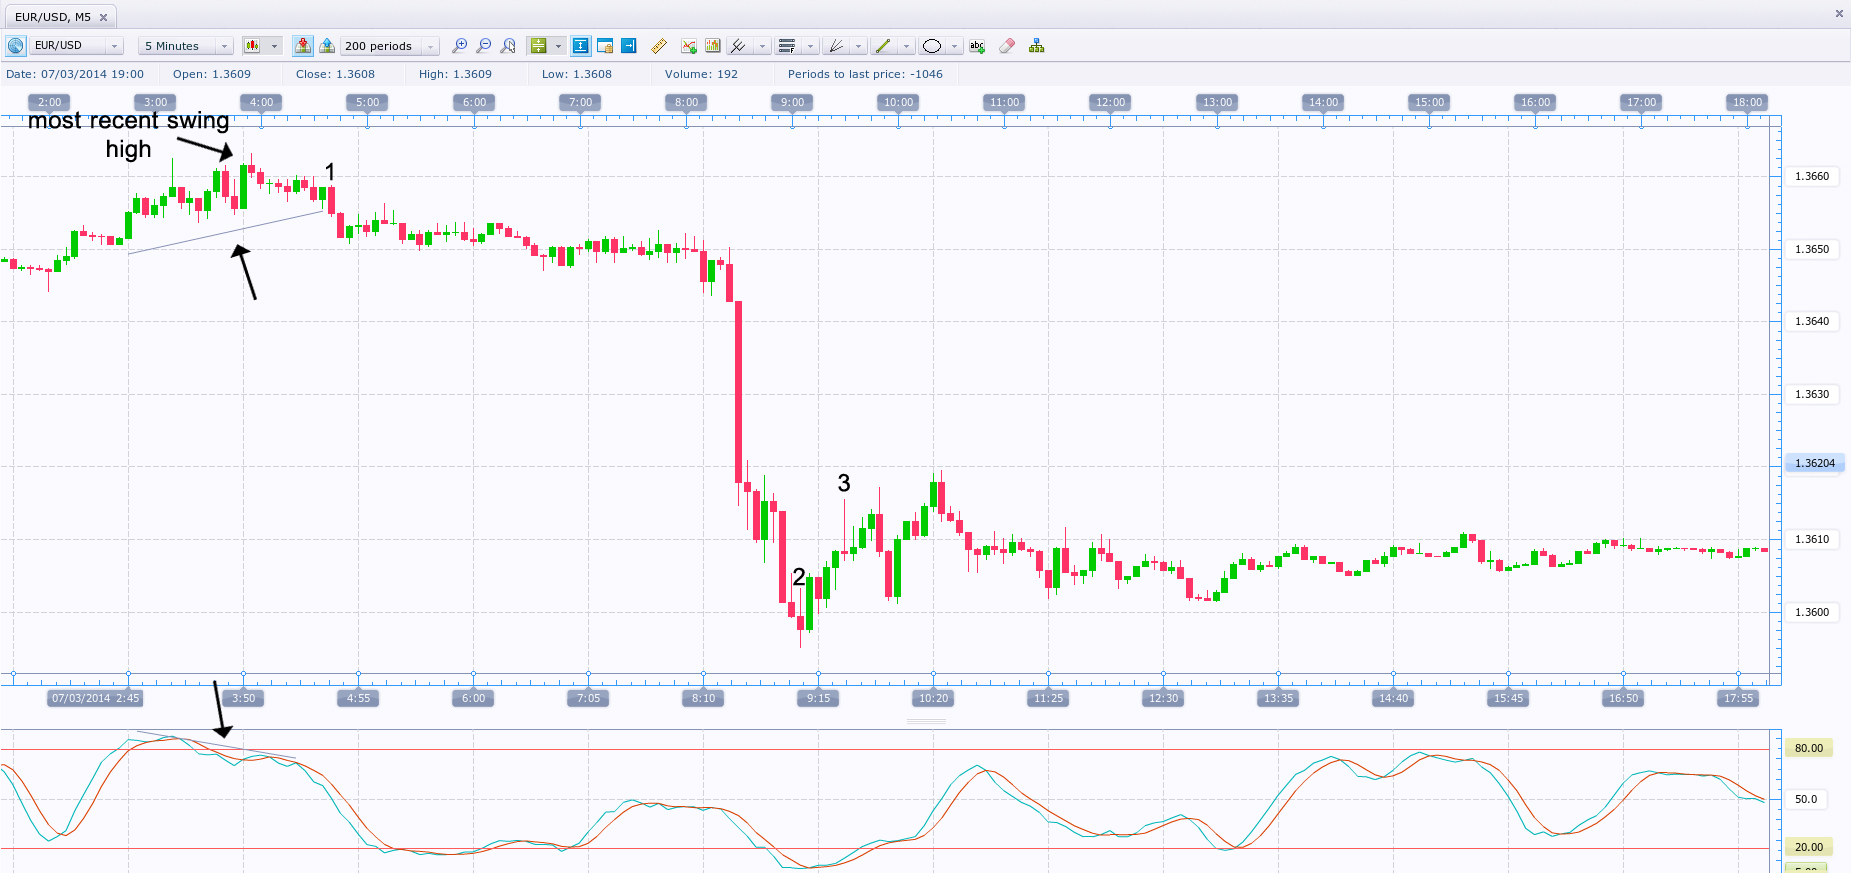
You can see that there was a divergence between the slow stochastic and the price, with its first point being in the overbought area. We had previously checked on the 30-minute time frame that the market is in a bear trend, with the ADX running a value of little over 25, suggesting a decent enough bear trend is in motion. Thus we will enter only short positions.
We go short beneath the low of bar 1 at 1.3654, while our stop-loss is placed 10 pips above the most recent swing high, which was at 1.3663. The market then entered a tight trading range but there were no reversal moves that could gun our stop.
As the market sold off later and fell to a new swing low, which was accompanied by the stochastic falling to a new low as well, we begin to trail our stop to 10 pips above the high of each successive bar, which has dropped to a new low. Following that principle, our last stop would be trailed to 10 pips above the high of bar 2, which will be gunned at 1.3613 US dollars at bar 3.
RSI divergence
 The following trading strategy is based on RSI divergences and is used to spot potential highs and lows in stock index futures. Although the signals it generates are not that frequent, they compensate by being more accurate than many other strategies. Like the stochastic strategy discussed above, you must aim for entries in the direction of a larger time frame trend. This can again be confirmed by using the Average Directional Movement Index.
For our strategy we will use a 30-minute time frame with a 6-period Relative Strength Index. Again like the previous system, we will be looking for divergences between RSI and the price. The divergences first peak or trough should be in one of the extreme areas (overbought above 70-80 and oversold below 30-20), while the second one does not have to. You need to enter as soon as the divergence is confirmed by a close of a bar in the signals direction.
Stop-loss should be placed on the same principle as the previous strategy and then trailed below or above the next swing low or high respectively. Profit should be taken as the trailed stop is hit, or in case you are trading stocks – at the close of the market (also dont forget not to enter new trades within the stock markets last working hour).