Trading Channels Using Andrews Pitchfork
You will learn about the following concepts
- What is Andrews Pitchfork
- How is it drawn
- Trading within the pitchfork formation
- Trading outside the lines
Andrews pitchfork is a widely used method to define robust support and resistance lines in a trending market, coupled with a median line that itself serves as a support/resistance area. Its inventor Dr Alan Andrews believed that the price gravitates around the medium line in 80% of the time, while isolated shifts in market sentiment would occasionally cause fluctuations that make up the remaining 20%.
Our strategy will not be based solely on the pitchfork, rather we will use it in conjunction with an oscillator to filter out the best possible trades. We will discuss those details later. Also, there are two ways for the pitchfork to be traded – you can either enter positions while the price movement is contained within the lines, or trades can be initiated upon breakouts from the pitchfork formation. Let us first say a few words about how Andrews pitchfork is plotted.
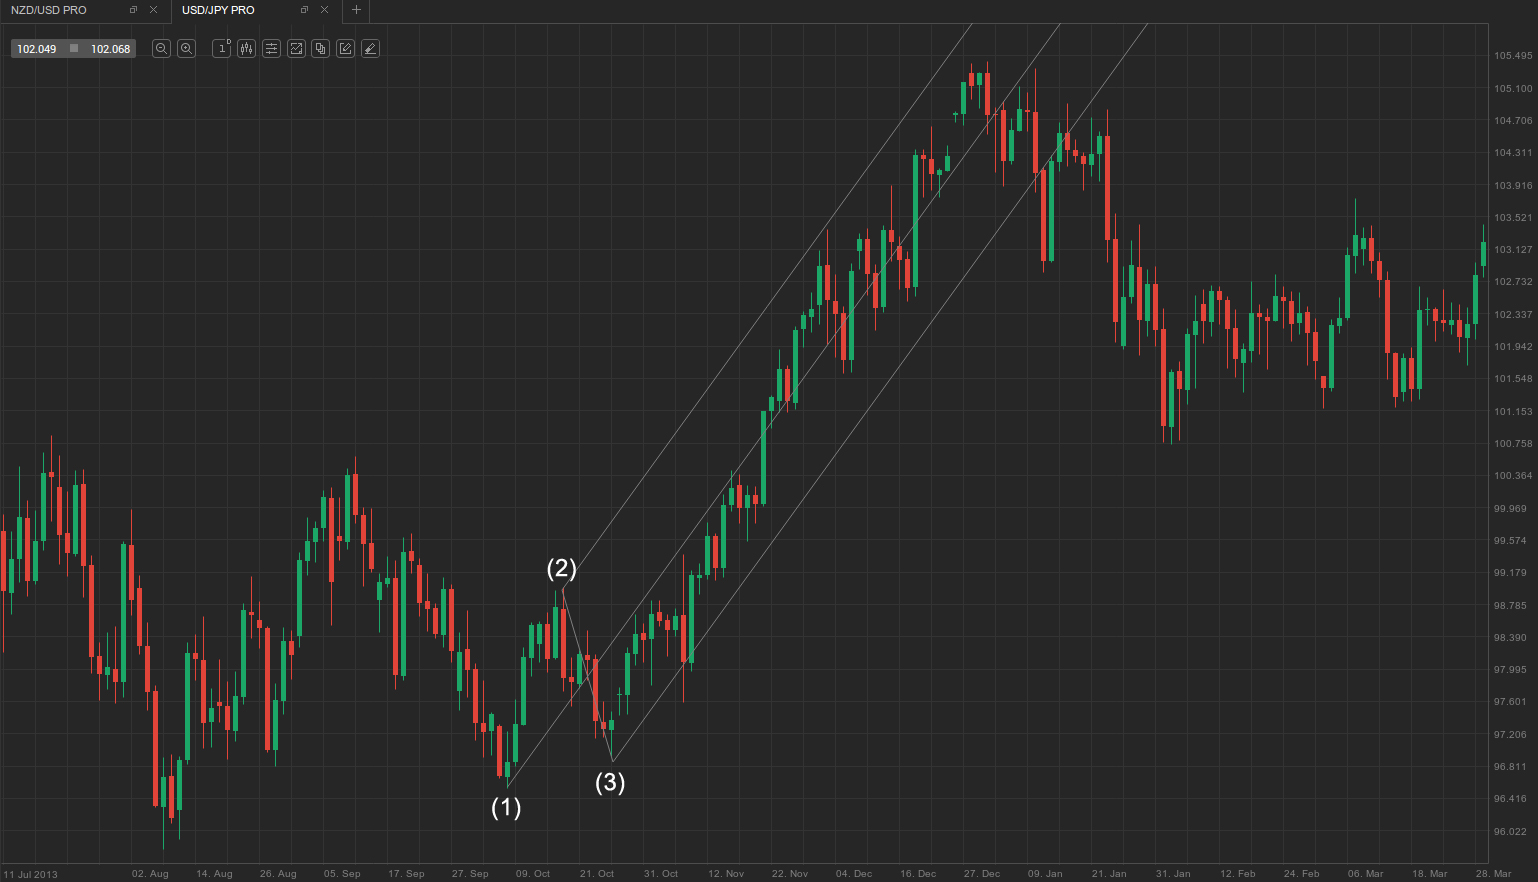
Applying the pitchfork begins with determining a pivot point, which is basically a high or low that has been formed on the chart. Once that point has been selected, we need two extensions on its right side. The second point will be the result of a move opposite to the first one which ended with the pivot point, while the third one will be in the direction of the pivot point. Thus, we can have a trough, followed by peak and a trough (forming a bullish pitchfork), or a peak, followed by a trough and a peak, which form a bearish pitchfork. Here is an example of a bullish Andrews Pitchfork.
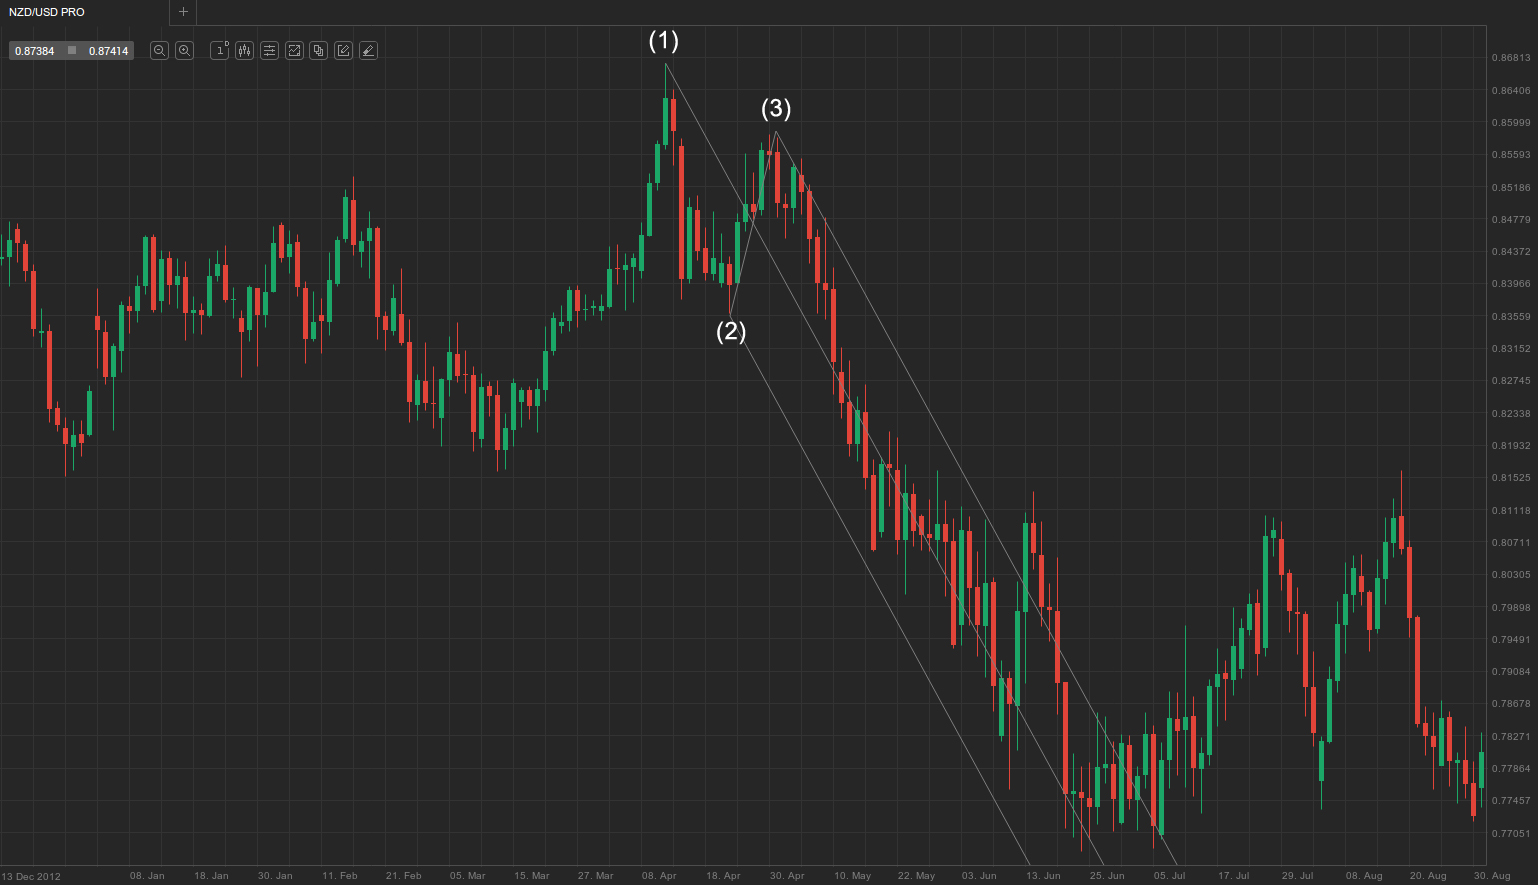
Here is how a bearish pitchfork looks like.
We said that there are two types of trading Andrews pitchfork – you can enter positions as the price action is boxed within the formation and bounces between the support/resistance lines, or you can isolate breakouts, thus trading outside the lines. We will discuss each separately.
Trading within the pitchforks lines
 This approach takes advantage of the in-channel price fluctuations. There are several steps that need to be followed. Lets assume that the market is moving down and we will be preparing for a short entry (entering in the direction of the general trend is preferred and more secure).
First, we need the price to have broken through the median line and to be edging higher toward the upper channel line.
As soon as it reaches and tests the resistance level, we need to identify a bearish reversal bar pattern – bearish engulfing, evening star etc. The formation of such a pattern will reflect waning strength in the up-move, increasing the odds for a successful reversal down.
Once the reversal pattern is evident, we need to confirm that the price is on the fall via an indicator – you can use stochastic, MACD etc. If, for example, the reversal bar pattern is confirmed by a bearish cross of the stochastics fast and slow lines (the fast line crosses the slow line from above and edges lower), then we have a confirmation.
As soon as the reversal is confirmed, we can proceed with the trade itself. We enter short several pips below the low of the reversal patterns last bar (thus it is our signal bar, while the next one is our entry bar). Our initial stop-loss should be placed around 40-50 pips above the entry point.
Our profit target should be at least 1:2 the amount risked, ideally even more. A more conservative money management strategy would be to exit half of our position once a 1:1 risk-reward ratio is achieved (if the price has fallen 50 pips), at which point we would also trail the stop to breakeven for the remainder of our position. As soon as double the amount risked is earned (the price has declined by 100 pips), you can choose to either fully exit the market, or scale out once again and leave a small portion on the market, trailing your stop even further. However, these are situational tips and may be irrelevant to certain scenarios. Check out the following example.
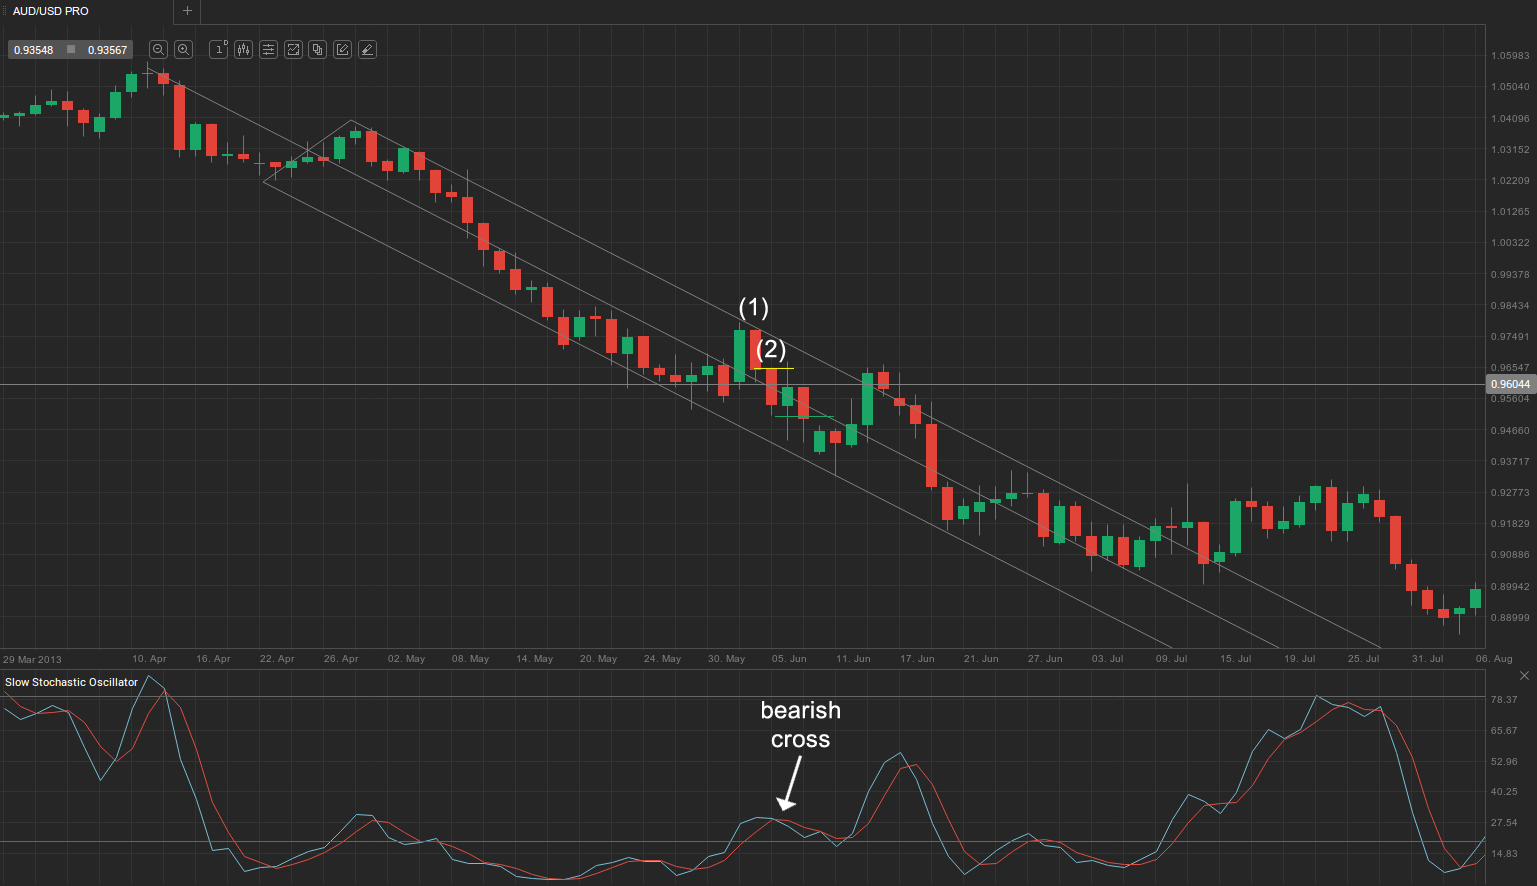
You can see that the market has entered a bearish pitchfork formation and it presents several trade opportunities once it has been identified. We decide to enter short after bar (1), since all the conditions required were met – the market had previously rebounded from the lower channel line, penetrated through the median line and continued to edge higher, touching the upper pitchfork line. Bar (1) and the previous bull trend bar formed a two-bar reversal (bar 1 reversed the previous bar and had a size of more than 75% of the preceding ones). Confirmation came as the stochastic oscillator performed a bearish cross (fast line crossed below the slow line).
Thus, as bar (1) closed and the two-bar reversal was now completely formed, it became a signal bar. Thus, we wait for bar (2) to fall below bar 1s low and enter several pips below it. Bar 1s low was at 0.9610 and so we enter short at 0.9604. Our stop-loss is placed 50 pips above the entry point, at 0.9654, as marked by the yellow horizontal line. Our profit target should be at least double the amount risked, or 100 pips, thus we aim to reach 0.9504 the least (the green horizontal line). Upon reaching it we might choose to scale out half of our position and trail our stop to breakeven in an attempt to reach 1:3 risk-reward ratio with the remainder of our position.
Trading outside the lines
Trading outside the pitchfork formation occurs less frequently and is trickier, but can also yield more considerable profit. The logic is that once the price has broken out of the pitchfork, it will most likely be pulled back to the median line. However, the possibility of a new trend to have formed also exists, which calls for a set of rules we must follow to reduce the chance of incurring heavy losses.
 Let us assume that we intend to join the market on bearish momentum.
First, we need to identify a situation where the price action has been above the upper pitchfork line (resistance line) for some time.
Next, we want to see that the price has reversed, penetrated the upper line, re-entered the channel and as is headed down toward the middle line.
Third, we need to have identified a significant support/resistance line, which falls between the upper line and the median line. This support/resistance line needs to have been broken by the price action, because that will confirm significant bearish momentum has been built, enough to keep driving the price down toward the median line and our profit target. Such significant support/resistance lines can be recent swing highs or lows that have been retested multiple times, round numbers etc.
Once the support/resistance line has been broken, we need confirmation from an oscillator – stochastic can do the trick. Once confirmed, we can enter the market with greater confidence. We place a sell order 30 pips below the support/resistance line with a stop several pips above the previous sessions high (as usual we leave a distance of 5-10 pips between the stop and the swing low/high so that random noise doesnt trigger it).
Profit target should be double the amount risked. However, similar to the previous type of Andrews Pitchfork trading, we can adopt a more conservative money management style. Upon achieving a 1:1 risk-reward ratio, you can exit half of the position, move the stop for the remainder of the position to breakeven, and carry out the last part of the trade until you achieve profit that is double the amount risked. Check out the following example.
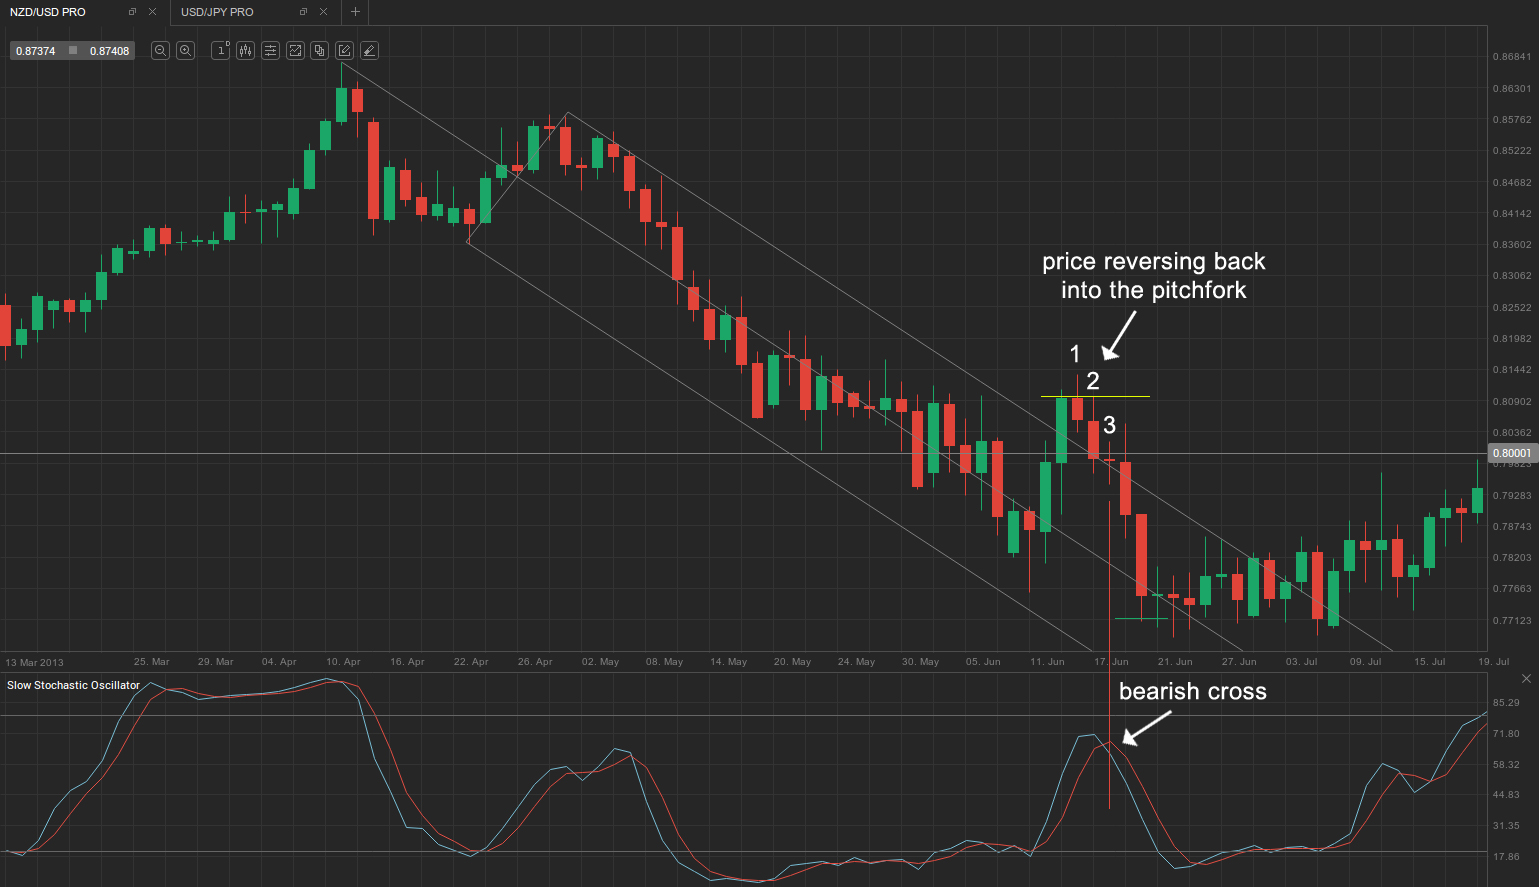
As you can see on the example above, the market reversed an outside move at bar (1). Another bear trend bar followed at bar (2), which led the price action back into the pitchfork formation.
On its way down, the market also broke a major support line at 0.8000 US dollars. The only thing left for us was to wait for a confirmation from our indicator of choice – the stochastic. At bar (3) the fast stochastic line crossed the slow line from above, generating a bearish signal, and so we enter short 30 pips below the major support line, thus at 0.7970. Our stop loss is at the high of the previous session, thus the high of bar (2) at 0.8098 (visualized by the yellow horizontal line). Our capital exposure is therefore 128 pips. Our profit target will be double that amount, or 256 pips, and it will be reached at 0.7714 (marked by the green horizontal line).