Intraday Doji bars. Trending Doji bars
This lesson will cover the following
- What is a doji bar
- What do dojis look like
- Doji bars connection with climaxes
- Dojis as part of a trend
Weve spoken a bit about doji candles in the previous article but now it is time to focus our full attention on them. Generally, and especially for beginner traders, it would be a lot simpler to call all non-trend candlesticks dojis. For a candle to be classified as a doji it should meet one requirement – it has to lack a body or its body should be very small, close to nonexistent. Such a small body indicates that neither bulls, nor bears had control over the market during the respective period, therefore the doji is basically a trading range consisting of one candle.
Of course, dojis bodies are a different amount of pips on different time frames. This means that on a weekly time frame a dojis extremely small body can be as much as 50 pips and more, but looking on that frame it does resemble a doji, so it makes sense to interpret it as such. What you need to look for is that the close is near the open or matches it in the perfect case scenario, but perfection is rarely observed.
Many successful price action traders suggest that classifying candlesticks with small bodies into many different categories such as hammer, hanging man etc. adds little value. Instead, a trader should focus on assessing whether the market is trending or ranging, and if in fact its moving in a distinct upward and downward direction, how strong that trend is.
Often seen in climactic movements
 In the previous article “Price action from trading ranges to strong trends” we explained what a climax is and how it forms. Dojis are one of the usual suspects marking the end of a climax.
It is worth considering that dojis themselves are climaxes. As you look at the price movement during their formation on a smaller time frame, you would see that the market either went up too far too fast and reversed down, creating a buying climax, or it went down and then reversed to the upside, marking a selling climax.
And as weve already discussed in the previous article, the formation of a climax does not mean that the market is about to reverse. It just shows that the price moved too far too fast, resulting most often in sideways market movement after an uptrend as bulls try to create an upside follow-through, while bears are pushing down for the creation of a downtrend. The market can trade in a range only briefly or it can enter a very long and narrow trading range. Because all dojis are made up of sideways trading, they should be deemed one-candle trading ranges, usually followed by at least few more non-trending candles.
Keep in mind that dojis quite often dont present good entry signals because they are one-candle trading ranges. In a ranging market, you shouldnt be buying above the high or selling below their low. Dojis however can be good signal bars when they are near the top or bottom of a trading range where the price is likely to rebound, thus suggesting entering a reversal position above or below their highs/lows.
Dojis can indicate a trend as well
 Despite the true nature of dojis showing sideways trading, a series of dojis can also sometimes illustrate the existence of a trend. For example, if you are seeing a certain number of dojis, each of which has a higher/lower close than the previous one, with a higher high and higher low/lower high and a lower low then you probably have a bullish/bearish trend because the market is showing a trending direction.
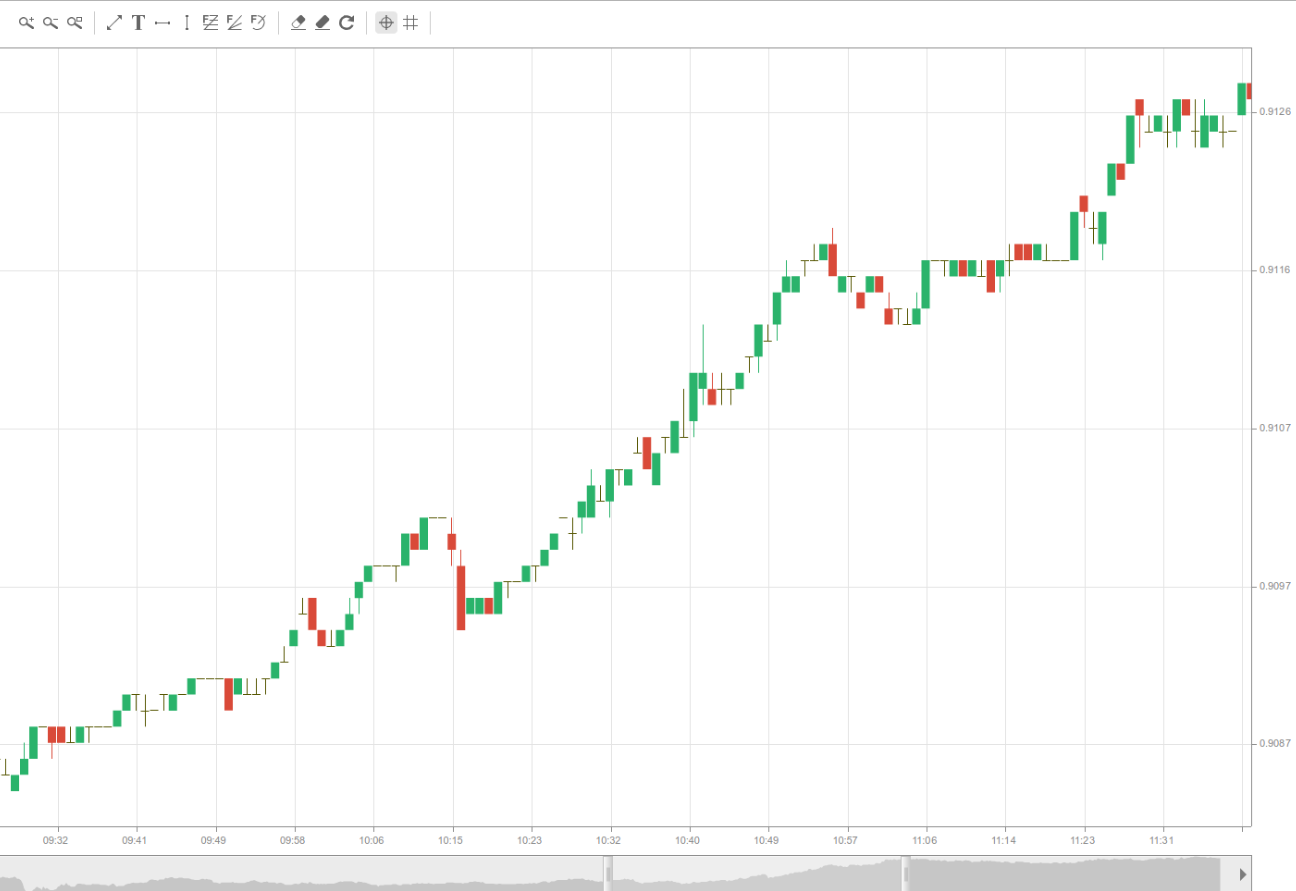
Individual dojis indicate equilibrium on the market as bulls and bears are relatively equally matched but a succession of trending dojis indicate a trend. For example, trending upward dojis show the building of buying pressure, which when observed on a higher time frame is visualized as a bull trend candle. Check the following screenshot. You can see an example of a very distinct and strong uptrend filled with dojis, which however overall are marking higher highs and higher lows, thus they are trending.
Another thing worth taking into consideration is that dojis are rarely perfect and that small-bodied candles might be acting as dojis sometimes, while perfect dojis might be taking part in forming a trend in other scenarios.
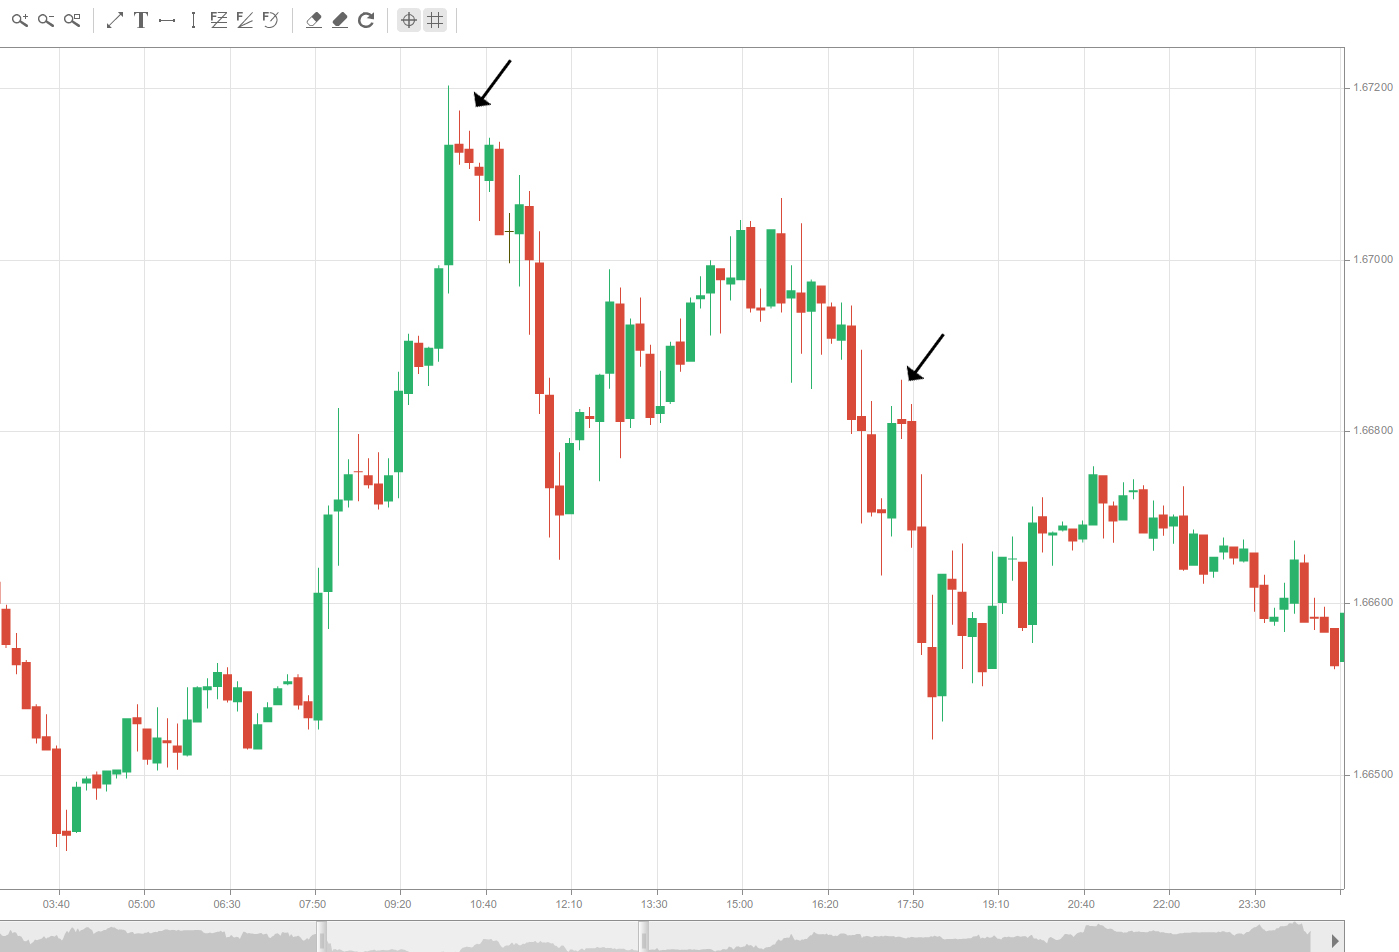
For example, a very strong trend might be filled with perfect-looking dojis, which is contradicting with their textbook definition, while bars with small, but existing bodies, may behave exactly as a doji. On the screenshot below you can see such an example.
Distinguishing whether a small-bodied candlestick is a doji or not depends very much on the area of price action where it is positioned. This is why the 2-way distinction of candles to trending and non-trending (doji) is there to help you in assessing who has control over the market or whether the bulls and bears are in a standoff.