Major trend reversals
This lesson will cover the following
- General thoughts on major trend reversals
- How to know when one occurs
- Different entry points
Previously in our guide weve underscored multiple times the importance of a traders ability to choose the best trades and avoid losers as much as possible, in order to become consistently profitable. Gaining that ability, of course, requires a lot of practice, sometimes even years of trading, but it is a goal every trader should strive to complete.
We have previously said that one of the most successful ways to profit from trading is to bet in the direction of the market during strong trends, and especially on pullbacks to the moving average. Moreover, we expressly emphasized that traders (especially less experienced ones) should avoid going against the market, until it has entered a definite trading range or a major trend reversal has occurred. If you would like to learn a thing or two about major trend reversals, please, read on.
Turnarounds
 Major reversals signify a complete shift in market momentum, which had continued for at least a couple of hours, and sometimes even for days. The best trend reversal patterns unfold after a major trend line is broken, which indicates that the counter-trend traders have established partial control over the market and are growing in strength.
In the article “Pullbacks in a Strong Trend – One of the Most Profitable Trades”, we said that often when the market breaks the trend line and the moving average after a protracted trend, and especially when it forms a gap bar, it usually reverses back and tests the trends extreme. This is the strongest type pullback and usually precedes a trend reversal.
After the trend line break, the price usually reverses back with a two-legged move that undershoots or overshoots the previous trend extreme and it is very likely that the trend will reverse, which makes it a suitable entry point for a counter-trend bet. The two pushes to the new extreme attempt to reestablish the old trend and that possibly failed second attempt to penetrate the previous resistance (the current trend extreme) has a strong chance of a reversal move with at least two legs which often transit into a new trend. However, if the market penetrates the trends extreme and continues beyond it, then the trend is likely resuming and you must wait for a new trend line and moving average break.
Different scenarios

On the screenshot below you can see a suitable Higher High counter-trend entry after a major trend line break (respectively a Lower Low entry during a bearish trend).
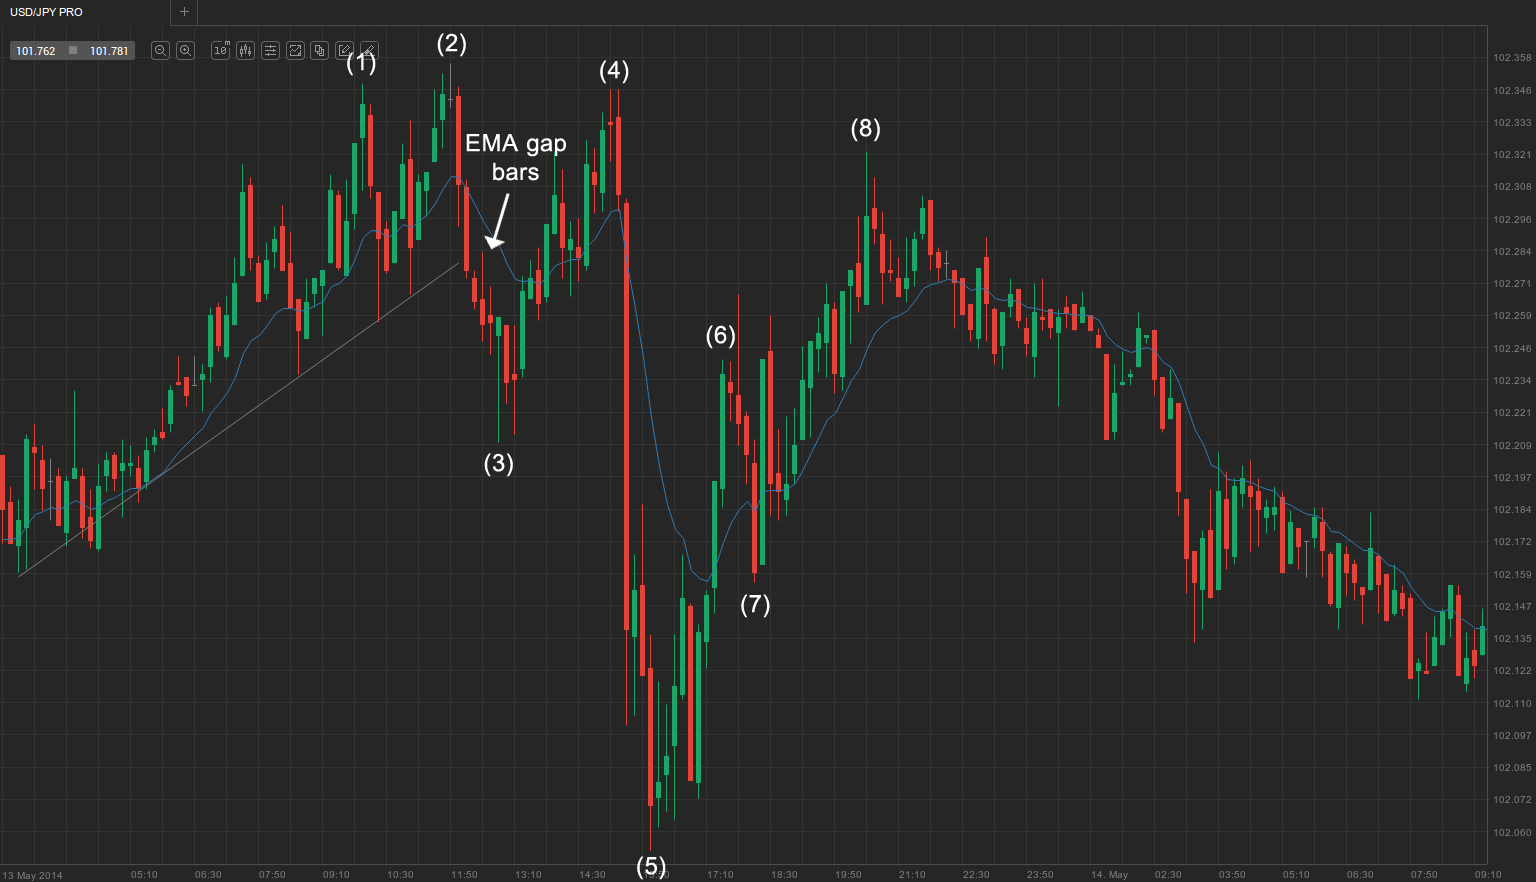
The market marked two new consecutive session highs, respectively at bars (1) and (2), before breaking both the trend line and EMA, forming six gap bars. It then pulled back and undershot the trend extreme, at bar (4), also forming a double-top bear flag with the bar after bar 2, thus generating a reliable short entry signal. A sell climax followed, which was paused by a bull trend bar, and a further sell-off down to bar (5). The sell climax was then reversed with a two-legged move up (up to bar 6 and then to bar 8), marking the end of the pullback and the continuation of the bear trend.
Two-legged pullback to Lower High in a bull trend
On the screenshot below you can see illustrated a bear trend reversal, followed by a two-legged pullback to a lower high, thus a high-probability second-entry short.
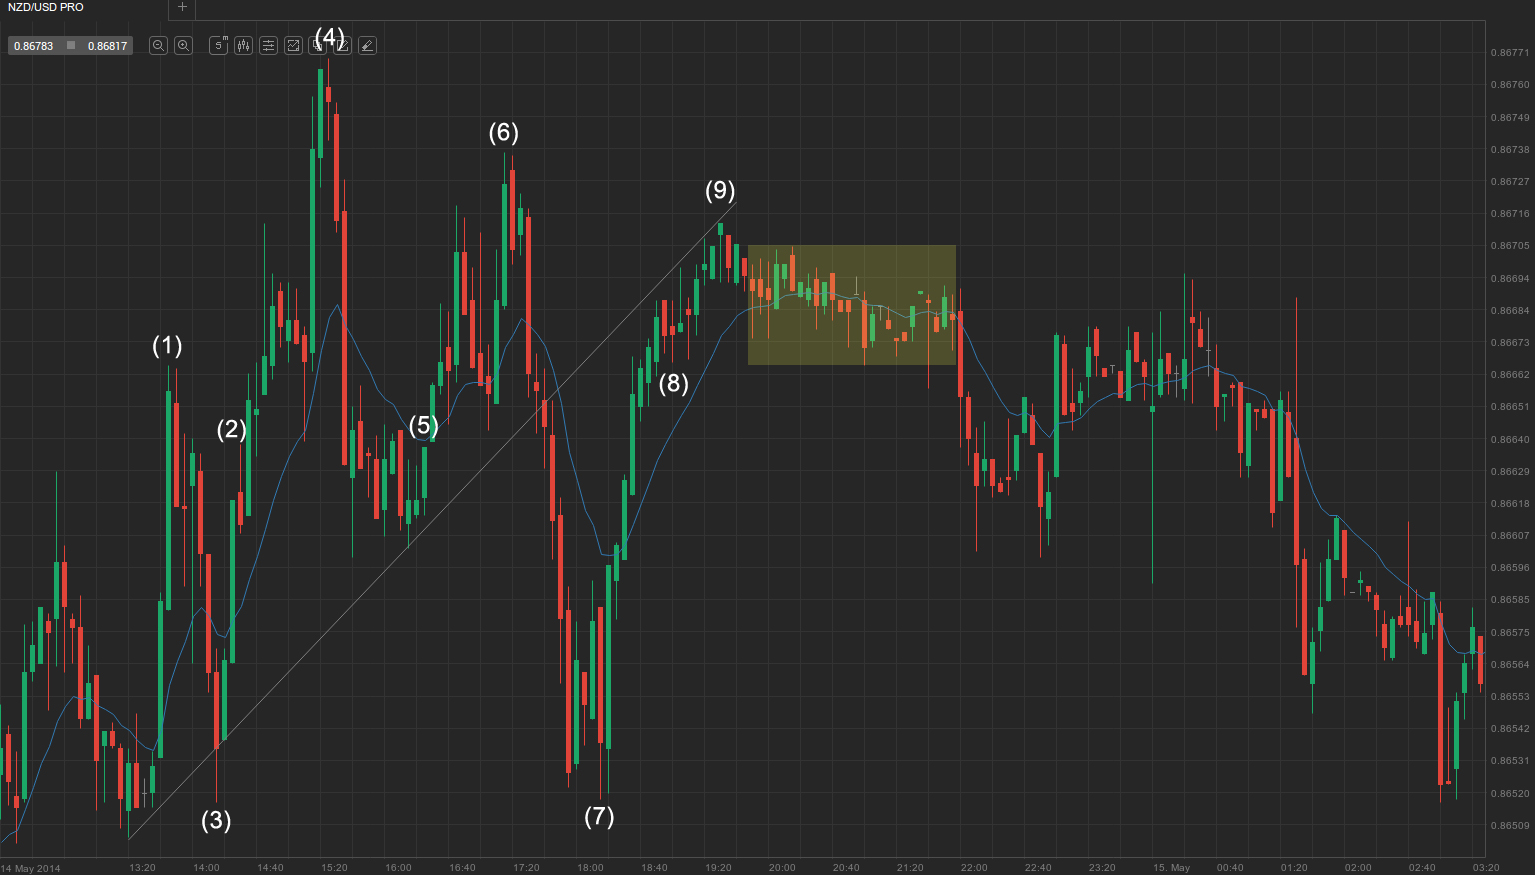
The trend accelerated to a new session high at bar (1), followed by a pullback to the trend line and the formation of two EMA gap bars. As expected, the market then rebounded to a new session high with a strong move up. Bar (2) was a huge double-shaved bull trend bar and market players who still werent on the market entered on a limit order above it, adding to buying pressure. A new session high was hit, followed by a pullback to the moving average, and then an acceleration to a new session high at bar (4). A pullback to the trend line followed after a sell climax, which formed 10 EMA gap bars. The rebound from the trend line was fueled by strong buying pressure, as evident by the top-shaved bull trend bar (5), and the next bull trend bar, which gapped up.
At bar (6), the market made a double top, and also an inside-inside pattern, therefore a suitable short-entry with a limit order below the low of the bear trend bar (for extra certainty below the low of bar 6). As the short limit orders were triggered, the market plummeted, breaking both the trend line and the moving average. The bar (7) swing low formed a double bottom with bar (3) and the market finished the correction with a two-bar reversal up. Market players now expected at least a two-legged move up to either a Higher High or a Lower High. The first leg of the pullback ended at bar (8), followed by a second rally to bar (9) – a Lower High, which was likely to be the end of the previous bull trend – therefore a suitable short-entry. The end of the bull trend was also backed by the “barbed wire” trading range, which continued for over 25 bars and a downward breakout was more probable. Nevertheless, traders should have waited for the breakout to occur, before positioning themselves.
Three-push pullbacks
In some cases, pullbacks dont consist of a single or two-legged pullbacks, rather more, and will require further analysis to assess where the Lower High or Higher Low will be standing, in order to get a reliable second-entry signal. Check the screenshot below.
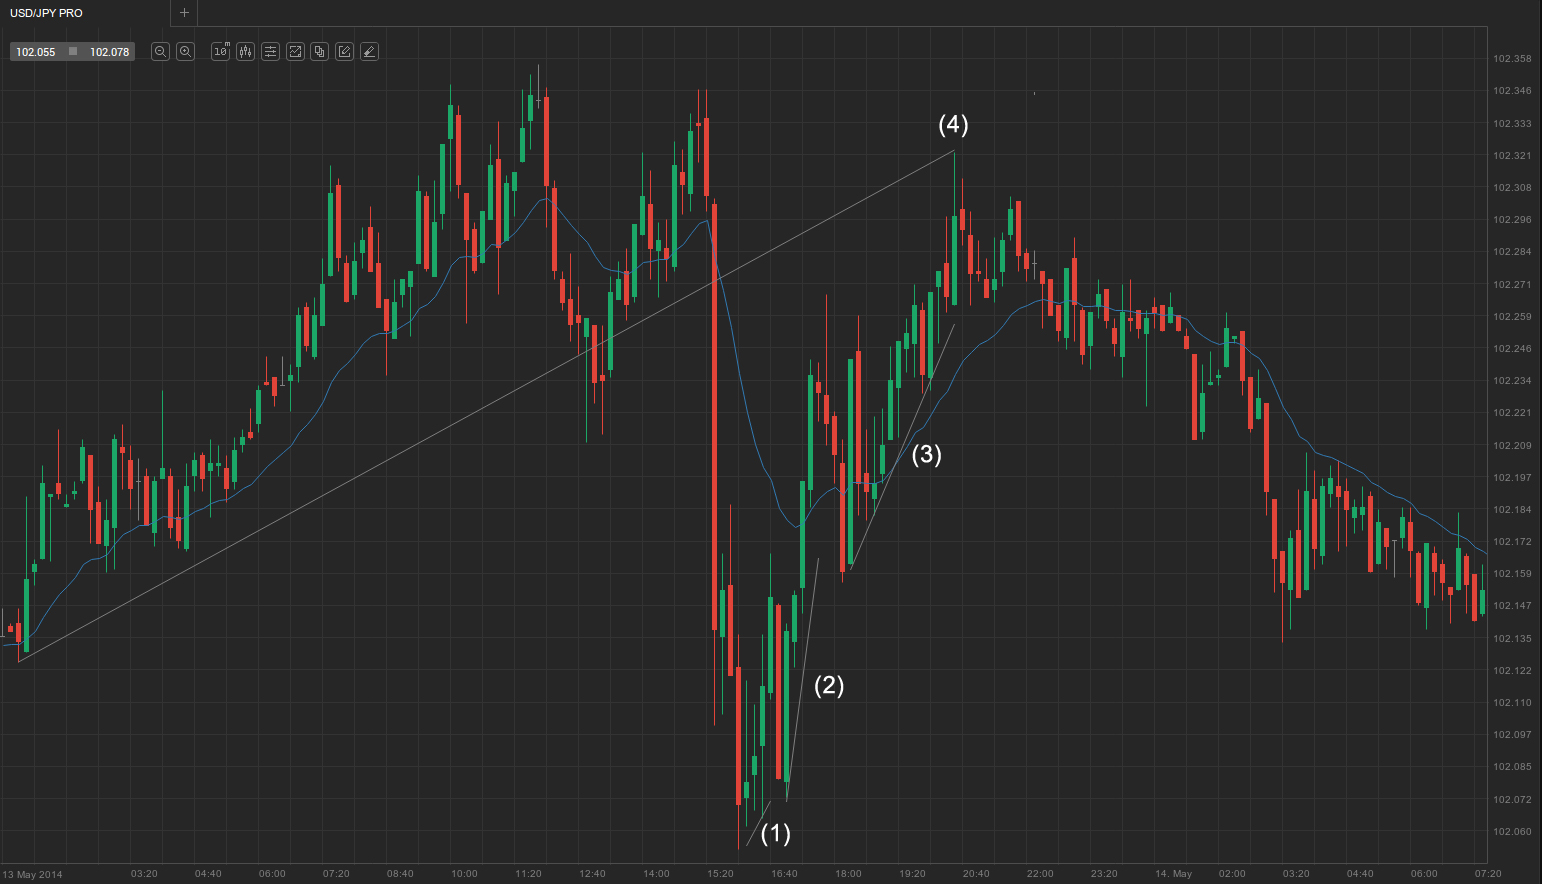
As you can see in the example above, the market pulled back and broke both the trend line and the moving average, forming 7 EMA gap bars. The following rally ended with a double top, which was also close to the session high, and the trend reversed with a huge climactic bear trend bar. The sell-off climax was paused by a bull trend bar, before the price fell further to a new session low. The following pullback consisted of three pushes up ((1), (2), (3)) instead of commonly just two, and extended up to bar (4).
Higher Low after a Lower Low in a bear trend
The same scenario as the Lower High in a bull trend is pictured below, but in a bear trend.
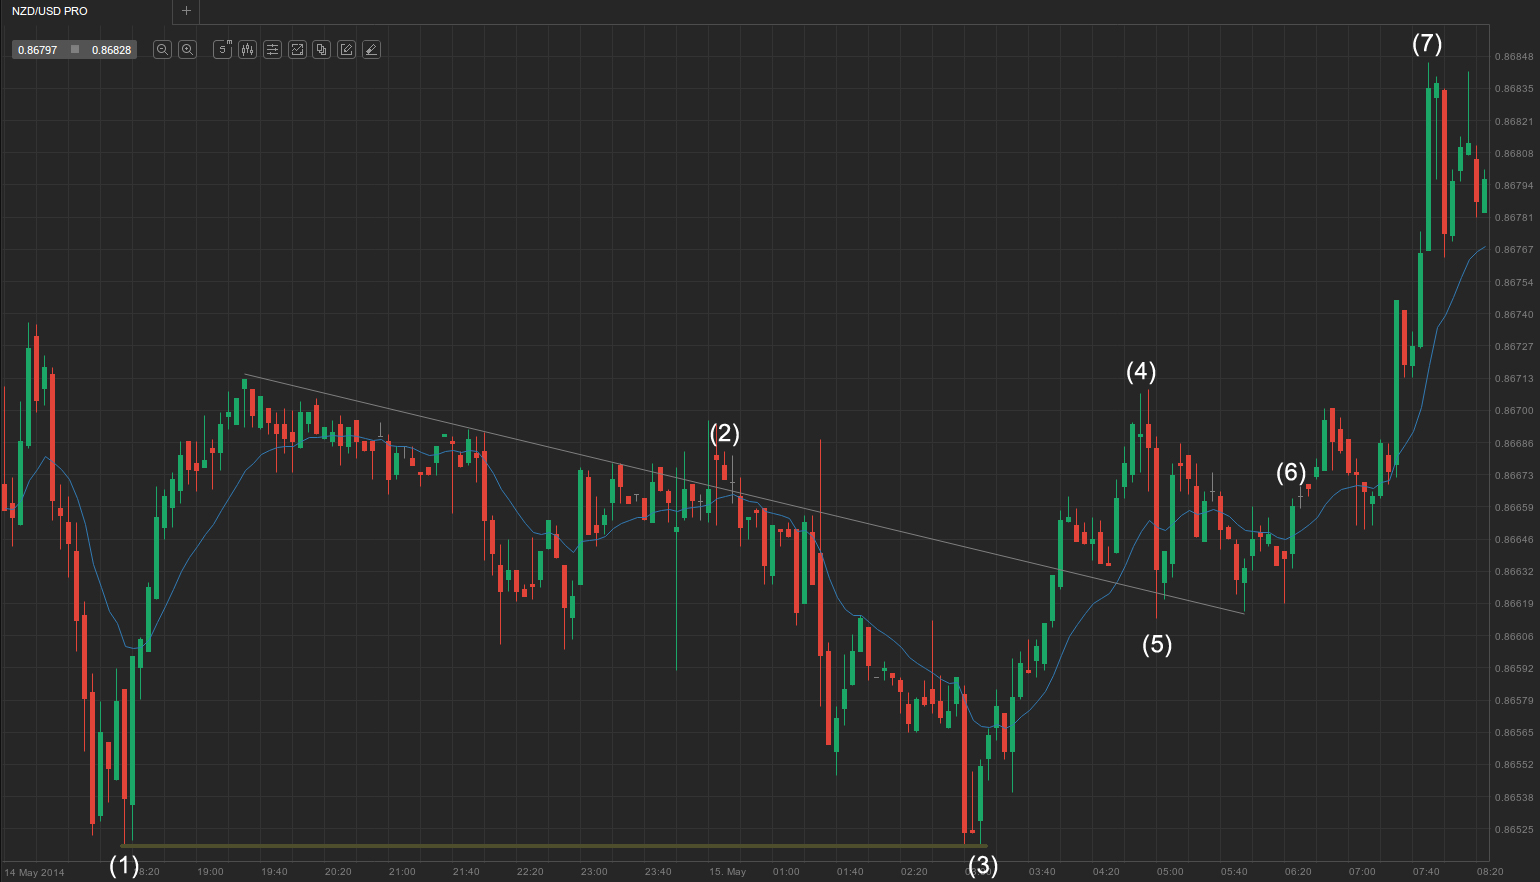
The trend illustrated above was weak at the beginning, somewhat resembling a “barbed wire” pattern at a point, but an acceleration followed. The price then rebounded and broke both the trend line and the moving average, forming a gap bar at (2). It then accelerated to a swing low at bar (3), which was a double-bottom bear flag and a double bottom with bar (1), generating a reliable long entry. Moreover, it was a strong bull trend bar after a doji, which came right after a sell climax, adding to the long entry signals reliability and warranting at least a two-legged move up, in our case to bar (4). The price then pulled back to bar (5), testing the trend line, which was a Higher Low below the moving average and a reliable second bull entry, at least a scalp. You should always consider buying the first Higher Low after a major Lower Low, which was the weakest price level for the day. The market then entered a descending triangle, what could also be seen as a falling wedge (not drawn), and broke out of it at bar (6), thus a continuation pattern, followed by a three-push acceleration to session high at bar (7).