Pattern transformation
This lesson will cover the following
- tterns have the ab
- The ability of patterns to evolve
- Some common transformations
Having covered the basics of price action, now you should be aware that every bar, forming at present, can mark the beginning of a huge price move in either direction. What is more, you need to examine very closely how price action develops, in order to detect whether a current setup is changing, progressing into something more complex, which could have the potential to reverse markets direction, thus, leading to a position in the opposite direction.
![]() Patterns have the ability to transform into other patterns, or to progress into bigger patterns. In both cases, price action may lead to entering into trades in either direction. If a trader analyzes price action in a correct way, this will enable him, most of the time, to obtain at least a scalpers gain (the amount a scalper will usually set as his/her profit target). A possible larger and more complex pattern can ensure this as well. As we already said, labeling patterns is not important. Analyzing correctly price movement and making an entry, based on this analysis, is what matters.
Patterns have the ability to transform into other patterns, or to progress into bigger patterns. In both cases, price action may lead to entering into trades in either direction. If a trader analyzes price action in a correct way, this will enable him, most of the time, to obtain at least a scalpers gain (the amount a scalper will usually set as his/her profit target). A possible larger and more complex pattern can ensure this as well. As we already said, labeling patterns is not important. Analyzing correctly price movement and making an entry, based on this analysis, is what matters.
 As an example of a transformed pattern, we can take a situation, where the pattern does not lead to obtaining a scalpers gain and what is more, it instead produces a signal for a trade in the opposite direction. This way some traders will find themselves trapped and forced to exit the market at a loss. Their exit will move prices further, so that a scalpers gain can be obtained in the opposite direction. Such a scenario is valid for any pattern.
Some common transformations
 A breakout from a micro trend line (a line drawn across two to ten bars, which touch or are close to the line itself) can be a failure and, respectively, a pullback can occur.
In stock trading practice, during the first hour of a trading day, it is common to observe a situation, where a double bottom bull flag (a bull flag in an uptrend, which has two distinct moves down to around one and the same price, and reverses back into the uptrend) can transform into a double top bear flag (a bear flag in a downtrend, which has two distinct moves up to around one and the same price, and reverses back into the downtrend).
A bull spike and channel trend (a breakout to the upside in a trend, followed by price action with less momentum, or in the form of a channel) can transform into a trading range, which can transform into a double bottom bull flag.
Example from stock trading practice
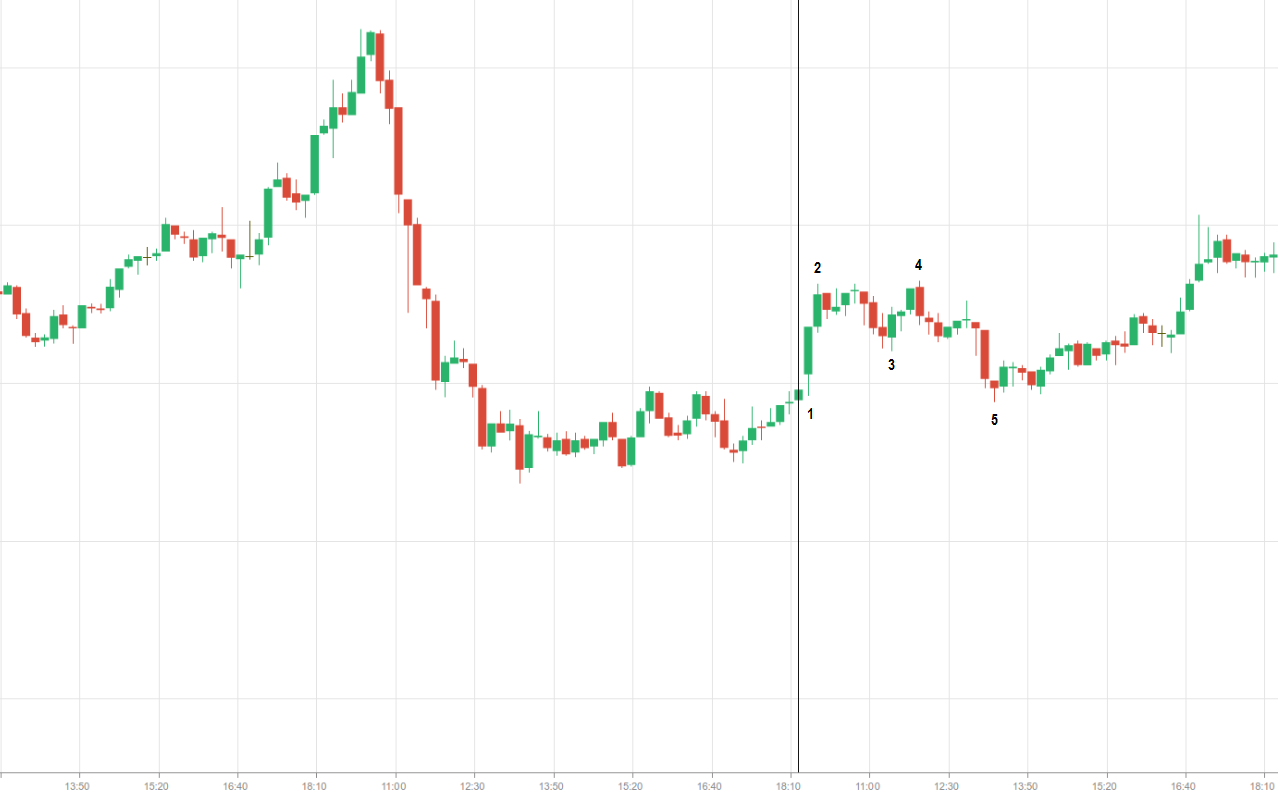
Now let us look at the 10-minute chart of BASF SE (BAS). We can see a double top pattern, which transformed into a double bottom bull flag. In this situation entries in both directions can be made. It is possible to go short below bar 4 and then to go long above bar 5.
One of the extremes usually occurs during the first hour of the trading day, giving a hint that prices may distance from this extreme level through the following several hours, sometimes even during the whole day (in this case the trading day becomes a trend day).