Spike plus channel trends – illustrations part I
This lesson will cover the following
- Parabolic nature of channels
- A case including a gap plus channel trend
- A case including a typical spike plus channel trend
Parabolic nature of channels
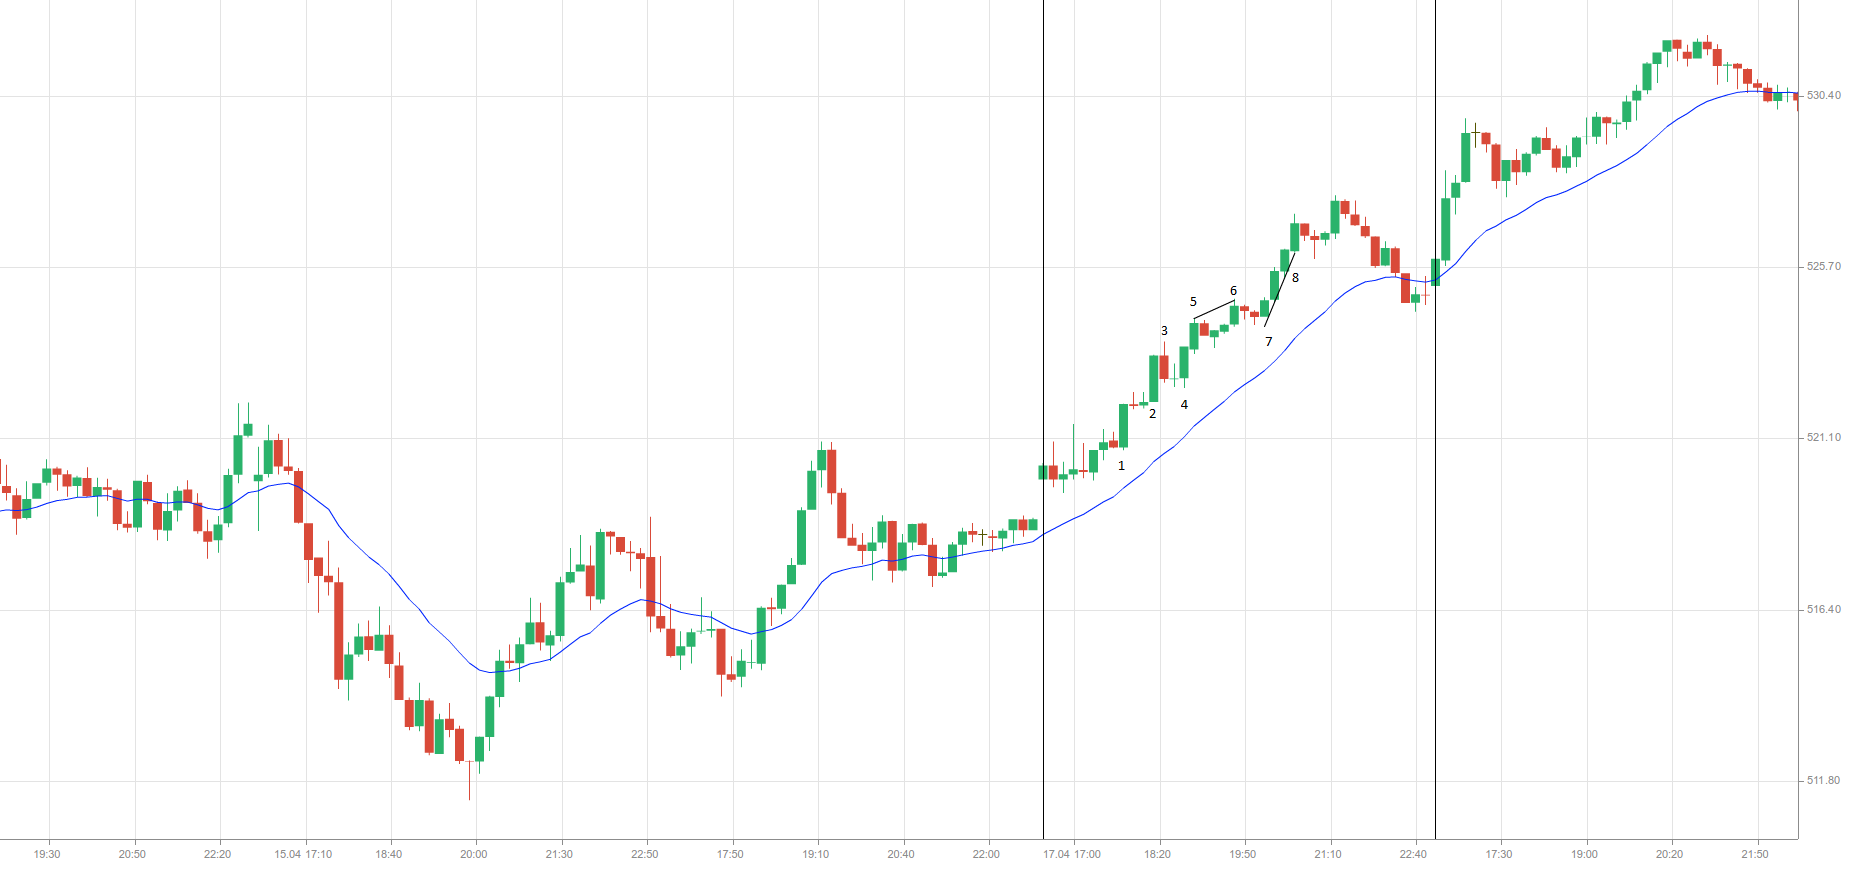
On the 10-minute chart of AAPL above we can see what a parabolic-shaped channel looks like. The move to the upside from bar 5 to bar 6 was in the form of a steep micro channel, but the price managed to break above this channel. What is more, it created an even steeper bull channel from bar 7 to bar 8. These two channels led to a parabolic-shaped increase in the slope, which can be considered as a type of climax. In many cases a climax is present for longer than a trader can sustain his/her account. Therefore, it is better if one does not attempt to go short during an uptrend as strong as one visualized on the chart.
In case ten or more strongly trending bars with short wicks and little overlap between them appear, this implies exceptionally strong uptrend. Traders will usually buy this trend at the market and not wait for a pullback. It is so, because they are very confident, that the price will climb to higher levels soon, but they are not certain whether a pullback will occur at all. If, however, one occurs, it may be shallow, lasting for several bars, after which the market usually forms a new high.
The move from bar 1 to bar 2 was a spike plus climax trend. Bar 1 was the spike, while instead of a channel, the market formed another spike at bar 2. Successive climaxes are usually followed by a larger pullback, that reaches the low of the second climax, as it was, to a certain extent, present on the chart (bar 4 low tested the low of bar 2). This scenario was also a double bottom bull flag. Spike plus channel trends usually lead to the same situation, so spike plus climax trends can be considered as a variation of the first.
Gap plus channel during a trading day
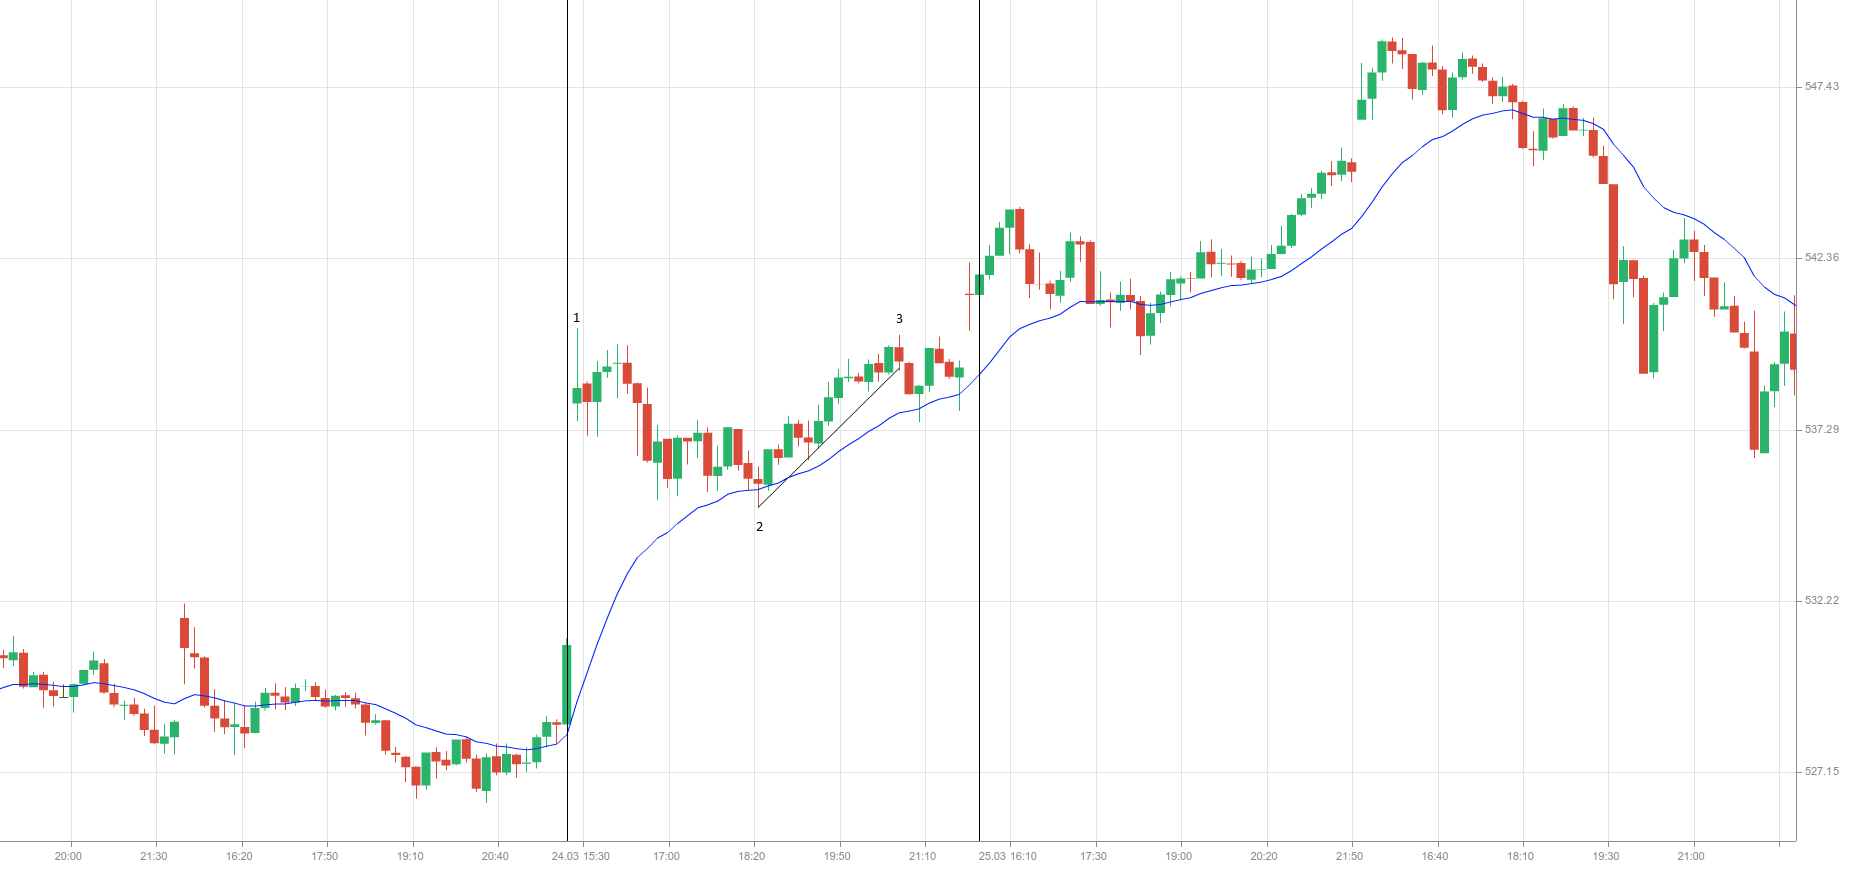
At times a gap can appear instead of a spike, which creates a gap plus channel trading day. This is visualized on the 10-minute chart of AAPL above. The move from bar 1 to bar 2 formed a bull flag, which led to a channel from bar 2 to bar 3.
Spike plus channel trends are common to observe
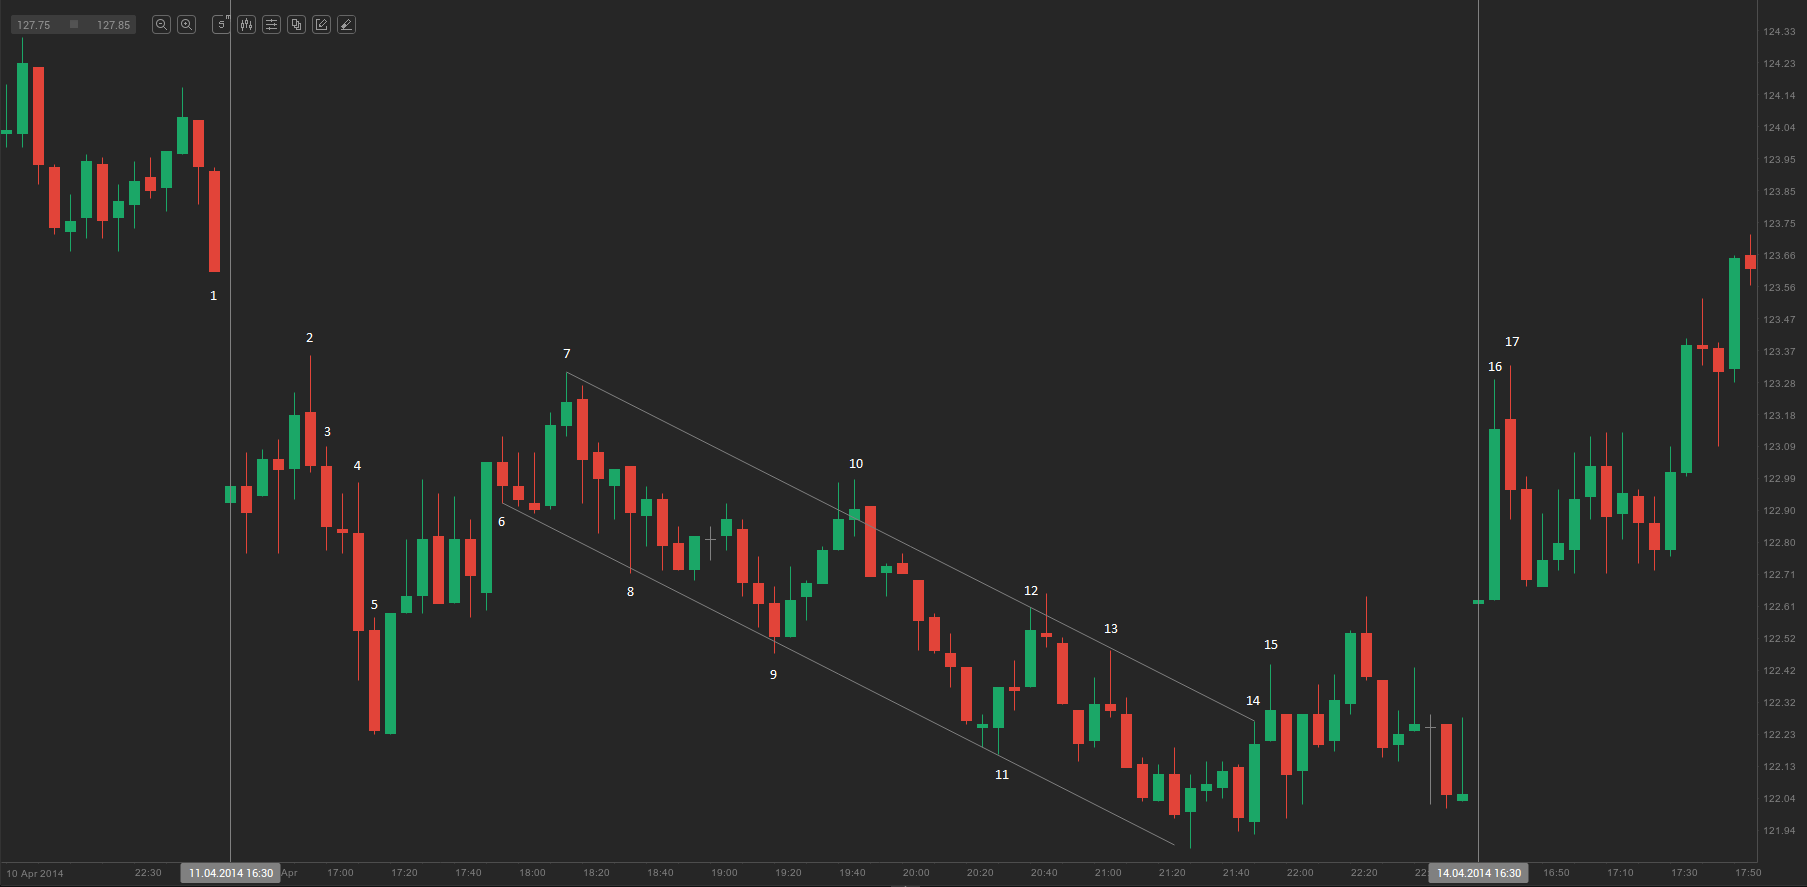
On the 5-minute chart of Boeing Co. (BA) above we can see what a spike plus channel trend looks like. The trading day on April 11th began with a gap (as we said above gap plus channel trends are a version of the spike plus channel trends). Bars 2, 3, 4 and 5 were consecutive sell climaxes, that were followed by a pullback, which tested the highs of bar 4 and bar 3. Then the market created a bear channel, which lasted during most of the trading day. Bars 1 and 2 also formed a bear flag.
Bar 15 broke above the bear channel. As prices tend to test the starting point of channels, traders may now look for long setups. However, the test of bar 7 high did not occur until the next trading day (April 14th). The beginning of the bear channel was tested by the high of bar 16 and exceeded by bar 17.
Within the bear channel bears might have scaled into their short positions and scalped for a number of reasons. They might have sold above the high of the prior bar, like above bar 9 or above the highs of the three bars following it. They might have also sold at the bear trend line (bars 12 and 13) or at any small break of this trend line (bar 10). Other sellers might have decided to go short on a fixed amount below each test of the upper area of the channel (for example, 1 point down after the test), because they suppose that more price action to the downside may be present. As this bearish move was seen on smaller time frames and other types of charts, market players trading off these charts might have likely gone short as well.
Buyers, following a more aggressive strategy, might have gone long in the same bear channel. One group of them might have scalped, buying at every test of the trend channel line (at lows of bars 8 and 11). Another group might have scaled in their long positions, hoping that the price might test the highs of bar 12 and bar 13 during the current trading day or during the one following it. Some buyers might have even scaled in with larger positions (for instance, two times the size of their previous position). Others might have been trading based on larger or smaller time frames and on tick charts or volume charts. There would have also been traders buying and selling, scaling in and out for any conceivable reason and still, they might have been successful.
However, the majority of traders would consider scaling into long positions in a bear channel during the final few hours of the day as a move of great risk. It is so, because often a trader may end up holding a huge losing position and will need to exit at a loss before the close of the day. It is more probable to make a profit when looking for short setups in a bear channel, than scaling into long positions.