Trading ranges that lead to trend reversals. Large move to the upside and large move to the downside
This lesson will cover the following
- Some ranges may cause a reversal
- A large up move and a large down move – how to interpret such a situation
Trading ranges that lead to trend reversals
 Trading ranges, which lead to trend reversals can often be spotted during trending trading range days, because a reversal usually occurs of the final trading range during the final 1-2 hours of the trading day. At times the low extreme during a bear trend day is produced from a small trading range, comprised by large bars, or bars with large wicks. Trading ranges, that lead to reversals, can be considered also as other setups (double bottom pullbacks, for instance).
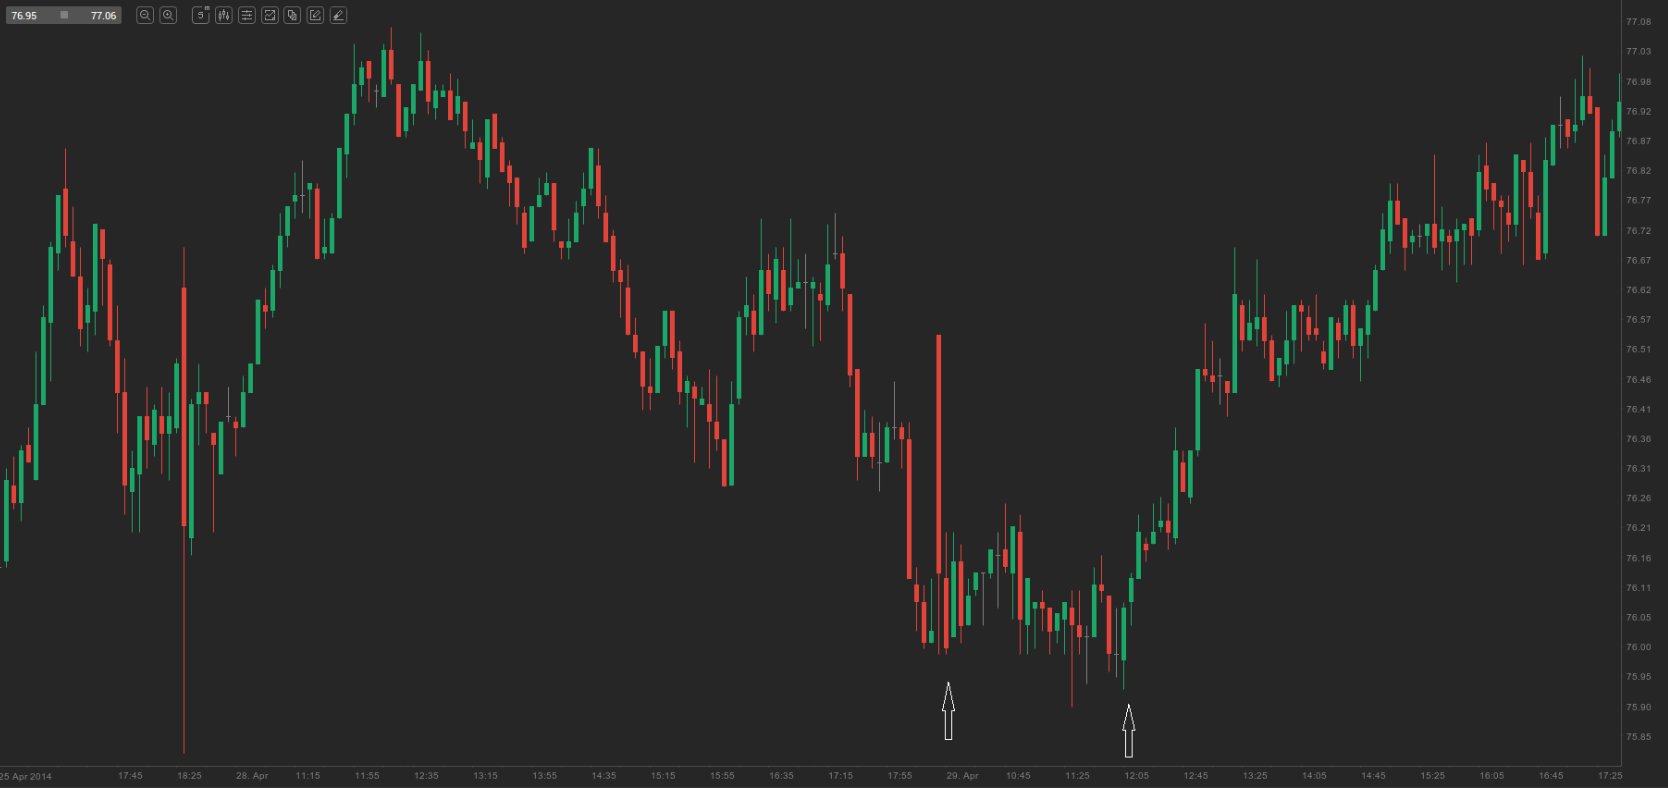
On the 5-minute chart of ADS above there was a considerable sell-off, followed by a trading range, comprised by large trend bars and bars with large wicks, which led to a reversal. This setup was a double bottom pullback bottom.
Large move to the upside and large move to the downside
 A trading range can sometimes be formed, when the price demonstrates a large move to the upside, followed by a large move to the downside, which corrects almost the entire move upwards. However, it is worth noting that such a scenario may lead to a new trend instead of a trading range. What a trader should look for, in this case, is if a reversal formation appears after the second move ends. If a reversal occurs, it should be enough at least for a scalp. If a reversal is not present, the second move could simply continue to trend, with its first measured target probably being at least twice the height of the first move.
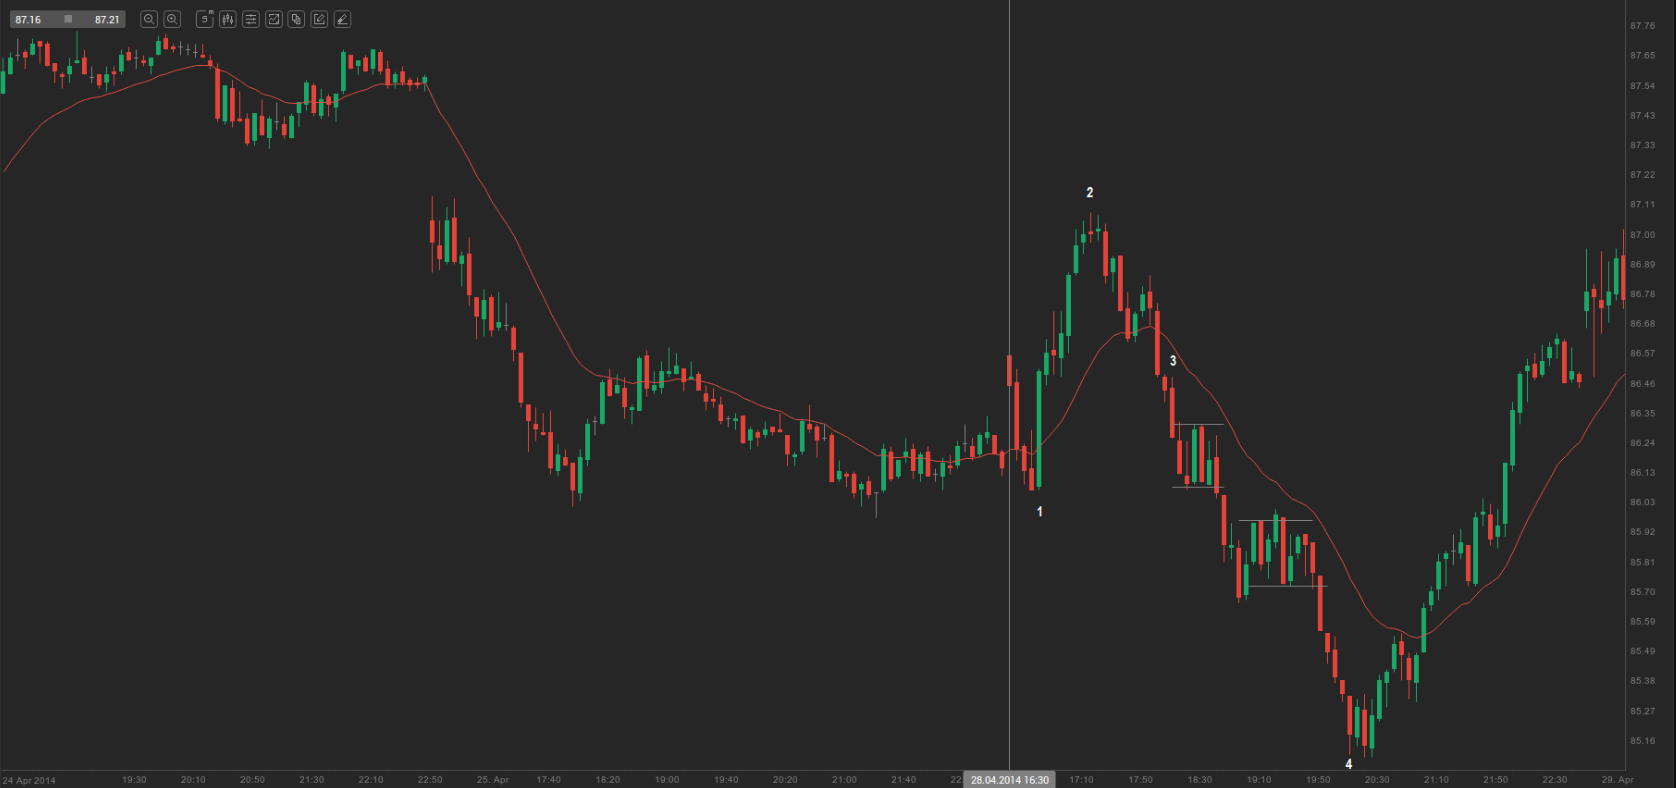
On the 5-minute chart of QQQ above there was a sharp move to the upside, which ended at bar 2 and marked a new daily high. It was followed by a sharp move to the downside. This sequence often implies indecision in the market and is followed by sideways trading. In our case there was a small trading range, then a breakout and another trading range. After the second range was breached, the move to the downside continued to bar 4, but it could not be considered as a measured move of the first one.